Tag Archives: Source Author

Initial Jobless Claims Fall 10.8%

By Justin Loiseau, The Motley Fool

Filed under:

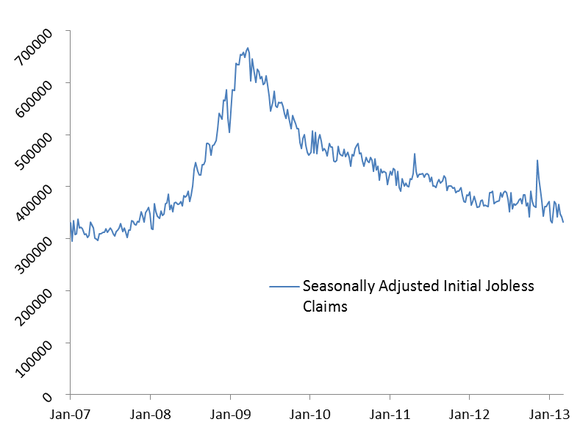
Initial jobless claims fell 10.8% to a seasonally adjusted 346,000 for the week ending April 6, according to a Labor Department report released today.

Compared to the previous week’s 8.7% jump, this latest report comes as a reprieve after three straight weeks of initial claims increases. Market analysts had expected only a drop to 365,000 initial claims.

Source: Author, data from Labor Department

While the four-week moving average bumped up 0.8% to 358,000, both the most recent week’s number and the moving average clocked in solidly below 400,000, a cutoff point that economists consider a sign of an improving labor market.

On a state-by-state basis, four states recorded decreases of more than 1,000 in their initial jobless claims for the week ending March 30 (most recent available data). Texas led the improvement (-3,490), followed by California (-2,660), North Carolina (-1,600), and Arkansas (-1,220). North Carolina was the only state to submit a reason for the drop, citing fewer layoffs in food and business industries.

For the same week, six states recorded increases of more than 1,000. Pennsylvania clocked an additional 3,015 initial claims, followed by New Jersey (+2,410) and Illinois (+2,150). Transportation and construction layoffs were a common theme for the slump.

link

The article Initial Jobless Claims Fall 10.8% originally appeared on Fool.com.

Y
ou can follow Justin Loiseau on Twitter, @TMFJLo, and on Motley Fool CAPS, @TMFJLo.
Try any of our Foolish newsletter services free for 30 days. We Fools may not all hold the same opinions, but we all believe that considering a diverse range of insights makes us better investors. The Motley Fool has a disclosure policy.

Copyright © 1995 – 2013 The Motley Fool, LLC. All rights reserved. The Motley Fool has a disclosure policy.

(function(c,a){window.mixpanel=a;var b,d,h,e;b=c.createElement(“script”);
b.type=”text/javascript”;b.async=!0;b.src=(“https:”===c.location.protocol?”https:”:”http:”)+
‘//cdn.mxpnl.com/libs/mixpanel-2.2.min.js’;d=c.getElementsByTagName(“script”)[0];
d.parentNode.insertBefore(b,d);a._i=[];a.init=function(b,c,f){function d(a,b){
var c=b.split(“.”);2==c.length&&(a=a[c[0]],b=c[1]);a[b]=function(){a.push([b].concat(
Array.prototype.slice.call(arguments,0)))}}var g=a;”undefined”!==typeof f?g=a[f]=[]:
f=”mixpanel”;g.people=g.people||[];h=[‘disable’,’track’,’track_pageview’,’track_links’,
‘track_forms’,’register’,’register_once’,’unregister’,’identify’,’alias’,’name_tag’,
‘set_config’,’people.set’,’people.increment’];for(e=0;e<h.length;e++)d(g,h[e]);
a._i.push([b,c,f])};a.__SV=1.2;})(document,window.mixpanel||[]);
mixpanel.init("9659875b92ba8fa639ba476aedbb73b9");

function addEvent(obj, evType, fn, useCapture){
if (obj.addEventListener){
obj.addEventListener(evType, fn, useCapture);
return true;
} else if (obj.attachEvent){
var r = obj.attachEvent("on"+evType, fn);
return r;
}
}

addEvent(window, "load", function(){new FoolVisualSciences();})
addEvent(window, "load", function(){new PickAd();})

var themeName = 'dailyfinance.com';
var _gaq = _gaq || [];
_gaq.push(['_setAccount', 'UA-24928199-1']);
_gaq.push(['_trackPageview']);

(function () {

var ga = document.createElement('script');
ga.type = 'text/javascript';
ga.async = true;
ga.src = ('https:' == document.location.protocol ?

From: http://www.dailyfinance.com/2013/04/11/jobless-claims/

Initial Jobless Claims Jump 7.8%

By Justin Loiseau, The Motley Fool

Filed under:

Initial jobless claims jumped 7.8% to a seasonally adjusted 385,000, according to a Labor Department report released today. Market analysts had been expecting a 2% dip  after the previous week’s unrevised 4.7% rise.

Source: Author, data from Labor Department

Longer-term trends provide little relief from these newest numbers. The four-week moving average jumped 3.3% to 354,250 after three consecutive weeks of increasing initial claims pushed the average higher last week.

Despite the increases, both the most recent week’s number and the moving average clocked in solidly below 400,000, a cutoff point that economists consider a sign of an improving labor market.

On a state-by-state basis, only Virginia recorded a decrease of more than 1,000 in its initial jobless claims for the week ending March 23 (most recent available data). The state pointed to fewer manufacturing layoffs as the primary reason for its 1,120 drop in initial claims.

For the same week, five states recorded increases of more than 1,000. California led the rise with 8,710 new initial claims, citing layoffs in the service, retail, and wholesale industries. Texas (+2,740) and Kansas (+1,610) followed behind, but did not provide any comments explaining their bumps in initial claims.

The article Initial Jobless Claims Jump 7.8% originally appeared on Fool.com.

Y
ou can follow Justin Loiseau on Twitter @TMFJLo and on Motley Fool CAPS @TMFJLo.
Try any of our Foolish newsletter services free for 30 days. We Fools may not all hold the same opinions, but we all believe that considering a diverse range of insights makes us better investors. The Motley Fool has a disclosure policy.

Copyright © 1995 – 2013 The Motley Fool, LLC. All rights reserved. The Motley Fool has a disclosure policy.

(function(c,a){window.mixpanel=a;var b,d,h,e;b=c.createElement(“script”);
b.type=”text/javascript”;b.async=!0;b.src=(“https:”===c.location.protocol?”https:”:”http:”)+
‘//cdn.mxpnl.com/libs/mixpanel-2.2.min.js’;d=c.getElementsByTagName(“script”)[0];
d.parentNode.insertBefore(b,d);a._i=[];a.init=function(b,c,f){function d(a,b){
var c=b.split(“.”);2==c.length&&(a=a[c[0]],b=c[1]);a[b]=function(){a.push([b].concat(
Array.prototype.slice.call(arguments,0)))}}var g=a;”undefined”!==typeof f?g=a[f]=[]:
f=”mixpanel”;g.people=g.people||[];h=[‘disable’,’track’,’track_pageview’,’track_links’,
‘track_forms’,’register’,’register_once’,’unregister’,’identify’,’alias’,’name_tag’,
‘set_config’,’people.set’,’people.increment’];for(e=0;e<h.length;e++)d(g,h[e]);
a._i.push([b,c,f])};a.__SV=1.2;})(document,window.mixpanel||[]);
mixpanel.init("9659875b92ba8fa639ba476aedbb73b9");

function addEvent(obj, evType, fn, useCapture){
if (obj.addEventListener){
obj.addEventListener(evType, fn, useCapture);
return true;
} else if (obj.attachEvent){
var r = obj.attachEvent("on"+evType, fn);
return r;
}
}

addEvent(window, "load", function(){new FoolVisualSciences();})
addEvent(window, "load", function(){new PickAd();})

var themeName = 'dailyfinance.com';
var _gaq = _gaq || [];
_gaq.push(['_setAccount', 'UA-24928199-1']);
_gaq.push(['_trackPageview']);

(function () {

var ga = document.createElement('script');
ga.type = 'text/javascript';
ga.async = true;
ga.src = ('https:' == document.location.protocol ? 'https://ssl' : 'http://www') + '.google-analytics.com/ga.js';

…read more

Source: FULL ARTICLE at DailyFinance

March Employment Underwhelms

By Justin Loiseau, The Motley Fool

Filed under:

Nonfarm private employment increased by a seasonally adjusted 158,000 jobs for March, according to ADP‘s National Employment Report  (link opens in PDF) released today.

Human capital management company ADP partners with Moody’s Analytics to produce this monthly report based on ADP payroll data representing 416,000 U.S. clients employing nearly 24 million workers in the U.S..

Source: Author, data from ADP

Although this month continues a three-year streak of improvements, month-to-month gains haven’t been this low since October 2012. After February’s revised 237,000 additional jobs, market analysts had expected a 205,000-job jump for March.

Moody’s Analytics Chief Economist Mark Zandi said in a statement today: “Job growth moderated in March. Construction employment gains paused as the rebuilding surge in the wake of Superstorm Sandy ended. Anticipation of Health Care Reform may also be weighing on employment at companies with close to 50 employees. The job market continues to improve, but in fits and starts.”

Goods-producing employment was the main culprit for March’s mediocre results, adding just 7,000 jobs for the slowest growth rate in six months. Services managed a 151,000 increase in employment, boosted primarily by a 39,000 gain for professional/business services.

link

The article March Employment Underwhelms originally appeared on Fool.com.

Y
ou can follow Justin Loiseau on Twitter, @TMFJLo, and on Motley Fool CAPS, @TMFJLo.
Try any of our Foolish newsletter services free for 30 days. We Fools may not all hold the same opinions, but we all believe that considering a diverse range of insights makes us better investors. The Motley Fool has a disclosure policy.

Copyright © 1995 – 2013 The Motley Fool, LLC. All rights reserved. The Motley Fool has a disclosure policy.

(function(c,a){window.mixpanel=a;var b,d,h,e;b=c.createElement(“script”);
b.type=”text/javascript”;b.async=!0;b.src=(“https:”===c.location.protocol?”https:”:”http:”)+
‘//cdn.mxpnl.com/libs/mixpanel-2.2.min.js’;d=c.getElementsByTagName(“script”)[0];
d.parentNode.insertBefore(b,d);a._i=[];a.init=function(b,c,f){function d(a,b){
var c=b.split(“.”);2==c.length&&(a=a[c[0]],b=c[1]);a[b]=function(){a.push([b].concat(
Array.prototype.slice.call(arguments,0)))}}var g=a;”undefined”!==typeof f?g=a[f]=[]:
f=”mixpanel”;g.people=g.people||[];h=[‘disable’,’track’,’track_pageview’,’track_links’,
‘track_forms’,’register’,’register_once’,’unregister’,’identify’,’alias’,’name_tag’,
‘set_config’,’people.set’,’people.increment’];for(e=0;e<h.length;e++)d(g,h[e]);
a._i.push([b,c,f])};a.__SV=1.2;})(document,window.mixpanel||[]);
mixpanel.init("9659875b92ba8fa639ba476aedbb73b9");

function addEvent(obj, evType, fn, useCapture){
if (obj.addEventListener){
obj.addEventListener(evType, fn, useCapture);
return true;
} else if (obj.attachEvent){
var r = obj.attachEvent("on"+evType, fn);
return r;
}
}

addEvent(window, "load", function(){new FoolVisualSciences();})
addEvent(window, "load", function(){new PickAd();})

var themeName = 'dailyfinance.com';
var _gaq = _gaq || [];
_gaq.push(['_setAccount', 'UA-24928199-1']);
_gaq.push(['_trackPageview']);

(function () {

var ga = document.createElement('script');
ga.type = 'text/javascript';
ga.async = true;
ga.src = ('https:' == document.location.protocol ? 'https://ssl' : 'http://www') + '.google-analytics.com/ga.js';

var s = document.getElementsByTagName('script')[0];
…read more
Source: FULL ARTICLE at DailyFinance

The Easy Road to Dow 17,000

By Alex Dumortier, CFA, The Motley Fool

Filed under:

It was a good day for stocks, with the S&P 500 gaining 0.5% while the narrower, price-weighted Dow Jones Industrial Average lost just 0.6%. That put both indexes at new (nominal) record-high closing values.

Reflecting these gains, the VIX Index , Wall Street‘s fear gauge, fell nearly 6% to close below 13. (The VIX is calculated from S&P 500 option prices and reflects investor expectations for stock market volatility over the coming 30 days.)

The bull market’s next leg
Professor Jeremy “Stocks for the Long Run” Siegel is still banging the stocks drum. This morning, in an interview with Barron’s Michael Santoli, he gave his end-of-year price target for the Dow:

This bull market has a lot of room to run yet… We are going to, by year end, be between 16,000 and 17,000 and in 2014, it will not surprise me to actually even reach higher than that, so 18,000 is a possibility. I see some good earnings coming out in the second half of this year.

However, he believes the next leg in the rally isn’t so much about earnings growth as it is about investors’ increasing willingness to pay up for those earnings:

I think we are going to bank on [price-to-earnings] multiple expansion and the reason is extraordinary low interest rates… I think the low interest rates are going to fuel continual multiple expansion; I think earnings are going to be better, but if you ask what is the biggest part of the increase over the next 12-18 months, I think it’s going to be multiple expansion.

Let’s take a look what it would take to get us to Dow 16,500 (the midpoint of Siegel’s forecast range) by year-end:


April 1, 2013

Dec. 31, 2013

% increase

DJIA Index Value

14,572.85

16,500.00

13.2%

Next 12 Months’ EPS*

$1,121

$1,223
(2014e)

9.1%

Forward P/E Ratio

13.0

13.5

3.8%

* Bottom-up estimate

Source: Author’s calculations, based on data from S&P Capital IQ.

On paper, a year-end target of 16,500 looks easily achievable under this framework, especially if we consider that it calls for de minimis 4% increase in the forward price-to-earnings ratio from a low starting point. It looks a little too neat, a little too easy.

Here’s why I don’t think Dow 16,500 is a slam dunk: Twelve-month forward earnings estimates are very volatile. A 9% increase between now and the end of the year looks conservative and dependable as a point estimate in a table, but the range of outcomes around that figure are pretty wide. Furthermore, corporate profit margins are already toward the very top of their historical range; conversely, on a cyclically adjusted basis, stocks look historically expensive.

I agree with Prof. Siegel that multiple expansion could fuel further stock gains, but I think there are good reasons why one should approach his forecast with a healthy dose of skepticism (as with any short-term forecast). It could come apart at the seams a lot more …read more
Source: FULL ARTICLE at DailyFinance

Supply Squeezes Pending Home Sales for February

By Justin Loiseau, The Motley Fool

Filed under:

The Pending Home Sales Index fell a slight 0.4% to 104.8 in February, according to a National Association of Realtors (NAR) report released today.

After improving a revised 3.8% in January, economists point to restrained housing supply as the primary cause of this month’s flatline. Despite the dip, these newest results managed to beat analyst expectations of a 0.7% decrease.

Source: Author, data from NAR.

The index is based on contract signings (with sales usually finalized one or two months later) and is benchmarked to 2001 contract activity. (An index of 100 is equal to the average level of contract activity during 2001, which was the first year to be examined by the association.) Although February‘s month-over-month results are lackluster, this report clocks in as the second-highest reading in nearly three years and is 8.4% higher than February 2012.

“Only new home construction can genuinely help relieve the inventory shortage, and housing starts need to rise at least 50 percent from current levels,” said NAR Chief Economist Lawrence Yun in a statement today. “Most local home builders are small businesses and simply don’t have access to capital on Wall Street. Clearer regulatory rules, applied to construction loans for smaller community banks and credit unions, could bring many small-sized builders back into the market.

A report released yesterday by the Department of Housing and Urban Development shows that new home sales fell 4.6% in February.

Looking ahead, Yun expects existing-home sales and prices to increase 7% in 2013. Yun also noted that, although mortgage interest rates should remain at historical lows, he expects an upward trend to push rates to 4% by Q4 2013.

link

The article Supply Squeezes Pending Home Sales for February originally appeared on Fool.com.

Y
ou can follow Justin Loiseau on Twitter, @TMFJLo, and on Motley Fool CAPS, @TMFJLo.
Try any of our Foolish newsletter services free for 30 days. We Fools may not all hold the same opinions, but we all believe that considering a diverse range of insights makes us better investors. The Motley Fool has a disclosure policy.

Copyright © 1995 – 2013 The Motley Fool, LLC. All rights reserved. The Motley Fool has a disclosure policy.

(function(c,a){window.mixpanel=a;var b,d,h,e;b=c.createElement(“script”);
b.type=”text/javascript”;b.async=!0;b.src=(“https:”===c.location.protocol?”https:”:”http:”)+
‘//cdn.mxpnl.com/libs/mixpanel-2.2.min.js’;d=c.getElementsByTagName(“script”)[0];
d.parentNode.insertBefore(b,d);a._i=[];a.init=function(b,c,f){function d(a,b){
var c=b.split(“.”);2==c.length&&(a=a[c[0]],b=c[1]);a[b]=function(){a.push([b].concat(
Array.prototype.slice.call(arguments,0)))}}var g=a;”undefined”!==typeof f?g=a[f]=[]:
f=”mixpanel”;g.people=g.people||[];h=[‘disable’,’track’,’track_pageview’,’track_links’,
‘track_forms’,’register’,’register_once’,’unregister’,’identify’,’alias’,’name_tag’,
‘set_config’,’people.set’,’people.increment’];for(e=0;e<h.length;e++)d(g,h[e]);
a._i.push([b,c,f])};a.__SV=1.2;})(document,window.mixpanel||[]);
mixpanel.init("9659875b92ba8fa639ba476aedbb73b9");

function addEvent(obj, evType, fn, useCapture){
if (obj.addEventListener){
obj.addEventListener(evType, fn, useCapture);
return true;
} else if (obj.attachEvent){
…read more
Source: FULL ARTICLE at DailyFinance

1 Dark Tale of a Dying Dividend

By Justin Loiseau, The Motley Fool

AT Chart

Filed under:

Before March 1, Atlantic Power was at the top of its game, doling out monthly dividends to the tune of 10% a year. Sure, there were skeptics who questioned how a small growth-by-acquisition utility could return that much cash directly back to shareholders, but the truth was this: Atlantic’s dividend knocked every other utilities’ out of the water.

But on March 1, the company reported quarterly earnings and announced a 66% dividend cut, shocking income investors who couldn’t sell their shares fast enough. Atlantic, the company that had pumped profits into their brokerage account month after month, was waving the white flag. Its stock plummeted:

AT data by YCharts.

Atlantic wasn’t the only utility to recently announce a dividend haircut. Exelon sliced its dividend by 40%, ending its 6.8% dividend yield for Q2 2013. But on Feb. 7, the day of the announcement, Exelon’s stock bounced up.

EXC data by YCharts.

Not all dividends are created equal
The reason for this mismatch is simple enough: Big dividends do not imply big profits, and Atlantic and Exelon are different companies. Their market caps alone put them in different bullpens, but each utility is in its own unique position. Their energy portfolios are different:

Source: Author; data from 10-K 

Source: Atlantic Power 10-K 

Their sales are headed in opposite directions, even as both utilities have acquired other businesses :

AT Revenue Quarterly Chart

AT Revenue Quarterly data by YCharts.

And, most importantly, each is in a very different debt situation:

EXC Debt to Equity Ratio Chart

EXC Debt to Equity Ratio data by YCharts.

Insult to injury
After Atlantic’s earnings report, I asked readers: Can it get any worse? The short answer: Yes.

As of last week, Atlantic may be in more trouble than even its books let on. Law firm Robins Geller Rudman & Dowd announced last Thursday that it is filing a class action lawsuit against Atlantic over allegedly misleading and/or false statements regarding its business and finances.

In its official complaint, the firm notes that “as the market learned the truth about Atlantic Power‘s mounting losses and its inability to maintain its outsized dividend through a number of misleading financial disclosures between Nov. 7, 2012, and March 4, 2013, more than $1 billion of the company’s market capitalization disappeared.”

These are serious allegations, and only time will tell whether Atlantic is found guilty of cooking its books. But either way, the once picture-perfect story of a darling dividend just grew darker.

Sustainable dividend
Big dividends don’t imply big profits, but they don’t imply big losses, either. Duke Energy‘s 0.23 cash dividend payout ratio ensures that its above-average 4.4% yield should be maintained for years to come, even as it dishes out $12 billion to modernize its aging generation fleet. Likewise, Ameren‘s 4.8% yield is …read more
Source: FULL ARTICLE at DailyFinance

Builder Confidence Drops Again

By Justin Loiseau, The Motley Fool

Filed under:

Builder confidence dropped again in March, according to a National Association of Home Builders (NAHB)/Wells Fargo Market Index report released today.

The index, which measures builders’  perceptions of current and future sales conditions, fell two points from February to reach 44 this month. Builder confidence in the market for newly built single-family homes leveled off in January after eight consecutive months of improvement, and has dropped since then, according to the NAHB.

Analysts had expected a one-point increase to 47 for March , which would’ve brought confidence closer to the 50-point mark, with over 50 indicating optimism outweighs pessimism.

Source: Author, data from NAHB

“Although many of our members are reporting increased demand for new homes in their markets, their enthusiasm is being tempered by frustrating bottlenecks in the supply chain for developed lots along with rising costs for building materials and labor,” said NAHB Chairman Rick Judson in a statement. “At the same time, problems with appraisals and credit availability remain considerable obstacles to completing deals.”

The main dip for March came from homebuilders’ perceptions of current sales, not future expectations. Although the current component fell four points to 47, traffic of prospective buyers over the next six months increased three points to 35 and sales expectations for the next six months bumped up one point to 51.

link

The article Builder Confidence Drops Again originally appeared on Fool.com.

Y
ou can follow Justin Loiseau on Twitter, @TMFJLo, and on Motley Fool CAPS, @TMFJLo.
Try any of our Foolish newsletter services free for 30 days. We Fools may not all hold the same opinions, but we all believe that considering a diverse range of insights makes us better investors. The Motley Fool has a disclosure policy.

Copyright © 1995 – 2013 The Motley Fool, LLC. All rights reserved. The Motley Fool has a disclosure policy.

(function(c,a){window.mixpanel=a;var b,d,h,e;b=c.createElement(“script”);
b.type=”text/javascript”;b.async=!0;b.src=(“https:”===c.location.protocol?”https:”:”http:”)+
‘//cdn.mxpnl.com/libs/mixpanel-2.2.min.js’;d=c.getElementsByTagName(“script”)[0];
d.parentNode.insertBefore(b,d);a._i=[];a.init=function(b,c,f){function d(a,b){
var c=b.split(“.”);2==c.length&&(a=a[c[0]],b=c[1]);a[b]=function(){a.push([b].concat(
Array.prototype.slice.call(arguments,0)))}}var g=a;”undefined”!==typeof f?g=a[f]=[]:
f=”mixpanel”;g.people=g.people||[];h=[‘disable’,’track’,’track_pageview’,’track_links’,
‘track_forms’,’register’,’register_once’,’unregister’,’identify’,’alias’,’name_tag’,
‘set_config’,’people.set’,’people.increment’];for(e=0;e<h.length;e++)d(g,h[e]);
a._i.push([b,c,f])};a.__SV=1.2;})(document,window.mixpanel||[]);
mixpanel.init("9659875b92ba8fa639ba476aedbb73b9");

function addEvent(obj, evType, fn, useCapture){
if (obj.addEventListener){
obj.addEventListener(evType, fn, useCapture);
return true;
} else if (obj.attachEvent){
var r = obj.attachEvent("on"+evType, fn);
return r;
}
}

addEvent(window, "load", function(){new FoolVisualSciences();})
addEvent(window, "load", function(){new PickAd();})

var themeName = 'dailyfinance.com';
var _gaq = _gaq || [];
_gaq.push(['_setAccount', 'UA-24928199-1']);
_gaq.push(['_trackPageview']);

(function () {

var ga = document.createElement('script');
ga.type = …read more
Source: FULL ARTICLE at DailyFinance

Jobless Claims Hit 5-Year Low

By Justin Loiseau, The Motley Fool

Filed under:

Initial jobless claims fell 2.9% to a seasonally adjusted 332,000 for the week ending March 9, according to a Labor Department report released today. After the previous week’s revised 1.4% drop, this latest jobs report marks the third straight week of declines in initial claims. Market analysts had forecast a 2.9% increase.

The real cause for celebration comes from this week’s longer-term look. As declines remain consistent, the four-week moving average crept down to 346,750 to reach its lowest level of the recovery, according to The Wall Street Journal. The AP reports that the four-week average notched its lowest level since the week of  March 8, 2008.

Both the most recent week’s number and the moving average clocked in solidly below 400,000, a cutoff point that economists consider a sign of an improving labor market. This latest news also comes one week after the Labor Department announced an unemployment rate drop to 7.7% for February.

Source: Author, data from Labor Department.

On a state-by-state basis, Massachusetts and North Carolina led the drop in initial claims for the week ended March 2 (most recent available data). Both states cited fewer layoffs in the transportation industry as one of the primary reasons for their respective 4,190- and 1,150-claim dips. After California’s initial claims fell a whopping 40,350 the previous week, the Golden State in the most recent jobs report registered the largest week-to-week increase in initial claims (11,720), due primarily to service sector layoffs.

link

The article Jobless Claims Hit 5-Year Low originally appeared on Fool.com.

Y
ou can follow Justin Loiseau on Twitter, @TMFJLo, and on Motley Fool CAPS, @TMFJLo.
Try any of our Foolish newsletter services free for 30 days. We Fools may not all hold the same opinions, but we all believe that considering a diverse range of insights makes us better investors. The Motley Fool has a disclosure policy.

Copyright © 1995 – 2013 The Motley Fool, LLC. All rights reserved. The Motley Fool has a disclosure policy.

(function(c,a){window.mixpanel=a;var b,d,h,e;b=c.createElement(“script”);
b.type=”text/javascript”;b.async=!0;b.src=(“https:”===c.location.protocol?”https:”:”http:”)+
‘//cdn.mxpnl.com/libs/mixpanel-2.2.min.js’;d=c.getElementsByTagName(“script”)[0];
d.parentNode.insertBefore(b,d);a._i=[];a.init=function(b,c,f){function d(a,b){
var c=b.split(“.”);2==c.length&&(a=a[c[0]],b=c[1]);a[b]=function(){a.push([b].concat(
Array.prototype.slice.call(arguments,0)))}}var g=a;”undefined”!==typeof f?g=a[f]=[]:
f=”mixpanel”;g.people=g.people||[];h=[‘disable’,’track’,’track_pageview’,’track_links’,
‘track_forms’,’register’,’register_once’,’unregister’,’identify’,’alias’,’name_tag’,
‘set_config’,’people.set’,’people.increment’];for(e=0;e<h.length;e++)d(g,h[e]);
a._i.push([b,c,f])};a.__SV=1.2;})(document,window.mixpanel||[]);
mixpanel.init("9659875b92ba8fa639ba476aedbb73b9");

function addEvent(obj, evType, fn, useCapture){
if (obj.addEventListener){
obj.addEventListener(evType, fn, useCapture);
return true;
} else if (obj.attachEvent){
var r = obj.attachEvent("on"+evType, fn);
return r;
}
}

addEvent(window, "load", function(){new FoolVisualSciences();})
addEvent(window, …read more
Source: FULL ARTICLE at DailyFinance

Costa Rica: "We Don't Want Monsanto!"

By Brian Stoffel, The Motley Fool

WFM Revenue TTM Chart

Filed under:

Over the past weekend, in the sleepy rural village of Atenas, Costa Rica, there was a weekend-long celebration in the town square.

But instead of the normal summer festivals, or an observance of the Lenten season for this predominantly Catholic nation, citizens were gathering for a different reason: Their canton (akin to a county in the United States) had just voted against the use of genetically modified seeds.

Source: Author’s photograph. These displays were made by local school children to highlight the diversity of native seeds available to farmers in the region.

 A little background
The recent backlash against GMOs and the company that predominantly sells them, Monsanto , began in late 2012, when a subsidiary of the company requested permission to plant about 5 acres of corn with genetically modified seeds produced by Monsanto.

The request led to a rash of demonstrations across the country, but on Jan. 22, the Costa Rican Ministry of Science and Technology granted the request.

This isn’t the first time such a request has been granted, as the country has already allowed about 1,100 acres of genetically modified cotton, soybeans, bananas, and pineapples to grow within its borders

It’s important to note two things: 1,100 acres represents an infinitesimal percentage of total land available for farming in Costa Rica; and none of the genetically modified products are allowed to be consumed or marketed within the country — they are for producing seeds to export or for research purposes only.

A brewing storm
As soon as word got out that Monsanto had been granted this exception, several groups began weighing in against the company. Besides environmental groups, the agricultural and biology departments at the University of Costa Rica, as well as the Costa Rican Agronomy Engineers’ Association, wrote letters warning of the inherent dangers of using seeds provided not by nature, but by scientists working in labs.

Many concerned parties began to mobilize to squash any attempt to bring genetically modified seeds into the country before a steady movement in that direction materialized.

Local cantons began voting in earnest to let their voice — and, if obeyed, their laws — be known. In fact, on the very same day Monsanto was granted its permission, the municipalities of Aserri, San Jose, and San Rafael de Heredia announced that GMOs would not be allowed in their soil. 

Since then, the response has been clear and direct. Of the country’s 81 cantons, 60% — or 49 in total — have voted to make it illegal to plant GMOs within the Canton lines. Keep in mind that most of this has transpired in just the past three months!

Source: Bloqueverde.blogspot.com

What it means for Fools
Obviously, not every country is going to have as direct a reaction to Monsanto — or any other company pushing GMOs — as Costa Rica has. And also keep in mind that Costa Rica‘s market potential pales in comparison with that of …read more
Source: FULL ARTICLE at DailyFinance

3 Graphs to Understand the Dow's New Record High

By Alex Dumortier, CFA, The Motley Fool

Filed under:

If you pay even the slightest bit of attention to the stock market, you will have heard by now that the Dow Jones Industrial Average
finally beat its October 2007 all-time nominal
high this week (the qualifier is important; more in a moment). Leaving out the fact that the price-weighted Dow is a flawed index (the broader, capitalization-weighted S&P 500 is less than 1% from its 2007 high), is there any real significance to this milestone?

Well, for one, it’s good reminder that, although the U.S. stock market has been a remarkable wealth-creation engine over time, it periodically suffers long periods of stagnation; both of these characteristics are clearly visible in this chart of the Dow’s full history (the scale is logarithmic, and the vertical grey bars indicate recessions):

The massive decline the stock market suffered at the height of the credit crisis in the fourth quarter of 2008 and the first quarter of 2009 is clearly visible in the upper right corner of the graph. That decline was severe enough that it has taken the Dow nearly five and a half years to get back to its October 2007 high. Or did it? The following graph, which shows Dow values on an inflation-adjusted basis, beginning in 1999, tells a different story:

Once inflation is accounted for — and make no mistake about it; inflation is a cost — not only has the Dow not recovered its 2007 high, but it remains below levels established in 1999! That’s terrible news for long-term investors. Thankfully, that isn’t the end of the story, for capital gains aren’t the only source of returns for equity investors. What about dividends? Inflation is a cost, but no one should ignore dividends in tallying returns. Here’s what the Dow chart looks like, including dividends and  after inflation, from 1999 onward:

Source: Author’s calculations, based on data from S&P Dow Jones Indexes and the Bureau of Labor Statistics

As the chart shows, the 2000s were undoubtedly a tough decade for equity investors, but they were no “lost decade” — even in real terms.

If you’re looking to harness the power of dividends with for some long-term investing ideas, check out the Fool’s special report: “The 3 Dow Stocks Dividend Investors Need.” It’s absolutely free, so just click here and get your copy today.

The article 3 Graphs to Understand the Dow’s New Record High originally appeared on Fool.com.

Fool contributor Alex Dumortier, CFA, has no position in any stocks mentioned; you can follow him on LinkedIn. The Motley Fool has no position in any of the stocks mentioned. Try any of our Foolish newsletter services free for …read more
Source: FULL ARTICLE at DailyFinance