Tag Archives: PCE

As ACA Implementation Continues, Consumer Health Care Cost Growth Has Slowed

By Alan Krueger

Prices for personal consumption expenditures (PCE) on health care goods and services rose just 1.1 percent over the twelve months ending in May 2013, the slowest rate of increase in nearly 50 years. The slowdown in PCE health care inflation has been widespread, with important contributions from two large components: hospital and nursing home services (which comprise 42 percent of total health care expenditures) and outpatient services (which comprise 34 percent of total health care expenditures). As the chart below shows, since March 2010, these two components of health spending have made notably smaller contributions to overall consumer health care inflation than in previous years.

The slowdown in consumer health care price inflation is consistent with a broad array of other evidence suggesting that the growth rate of health care costs is slowing:

  • Data from the Bureau of Labor Statistics’ Employer Costs for Employee Compensation survey indicate that for private sector employers offering health insurance, the annualized growth rate of real (inflation-adjusted) costs for workers’ health insurance has slowed from 2.2 percent a year from 2006:Q4 to 2009:Q4 to 1.8 percent a year from 2009:Q4 to 2012:Q4, with a particularly marked slowdown occurring at smaller establishments. For establishments with fewer than 50 employees, employers’ real costs for workers’ health insurance grew just 1.0 percent a year from 2009:Q4 to 2012:Q4, half the rate observed over the preceding three years.
  • During the past several years, the Congressional Budget Office reports that it “has made a series of downward adjustments to its projections of spending for Medicaid and Medicare.” For example, “mostly reflecting the slower growth in the programs’ spending in recent years,” CBO now expects combined spending on the two programs to be about $200 billion lower in 2020 than what it forecast three years ago.
  • From 2009 to 2011, nationwide real per capita health expenditures grew at the slowest pace since reporting began in 1960.
  • In 2012, premium growth for employer-sponsored insurance was at its lowest rate (3 percent) since the Medical Expenditure Panel Survey started in 1996.

  • In 13 states that have publicly reported premiums for 2014, the average of the lowest-cost plan is nearly 20 percent below projections based on CBO premiums. This includes New York State, which recently announced that health insurance rates in 2014 will be at least 50 percent lower, on average, than the plans currently available in the state. These substantially more affordable plans will soon be available through the new Health Insurance Marketplace established by the Affordable Care Act.

read more

…read more

Source: FULL ARTICLE at The White House

Commerce Department Releases Personal Income and Spending Data for February

By Eric Volkman, The Motley Fool

Filed under:

Americans became incrementally richer this past February. According to the Commerce Department‘s latest release on personal income and outlay data compiled by the Bureau of Economic Analysis, the category grew during the month by $143.2 billion, or 1.1%, over January’s level. Disposable personal income also advanced, as did personal consumption expenditures. The growth in those categories was by $127.8 billion (1.1%), and $77.2 billion (0.7%), respectively, over that same time frame.

The fortunes of those indicators were mixed on a month-over-month basis in January. Personal income dropped by $513.5 billion (3.7%), while DPI fell by $498.3 billion (4%). On the other hand, PCE climbed by $40.8 billion ( 0.4%).

The article Commerce Department Releases Personal Income and Spending Data for February originally appeared on Fool.com.

Try any of our Foolish newsletter services free for 30 days. We Fools may not all hold the same opinions, but we all believe that considering a diverse range of insights makes us better investors. The Motley Fool has a disclosure policy.

Copyright © 1995 – 2013 The Motley Fool, LLC. All rights reserved. The Motley Fool has a disclosure policy.

(function(c,a){window.mixpanel=a;var b,d,h,e;b=c.createElement(“script”);
b.type=”text/javascript”;b.async=!0;b.src=(“https:”===c.location.protocol?”https:”:”http:”)+
‘//cdn.mxpnl.com/libs/mixpanel-2.2.min.js’;d=c.getElementsByTagName(“script”)[0];
d.parentNode.insertBefore(b,d);a._i=[];a.init=function(b,c,f){function d(a,b){
var c=b.split(“.”);2==c.length&&(a=a[c[0]],b=c[1]);a[b]=function(){a.push([b].concat(
Array.prototype.slice.call(arguments,0)))}}var g=a;”undefined”!==typeof f?g=a[f]=[]:
f=”mixpanel”;g.people=g.people||[];h=[‘disable’,’track’,’track_pageview’,’track_links’,
‘track_forms’,’register’,’register_once’,’unregister’,’identify’,’alias’,’name_tag’,
‘set_config’,’people.set’,’people.increment’];for(e=0;e<h.length;e++)d(g,h[e]);
a._i.push([b,c,f])};a.__SV=1.2;})(document,window.mixpanel||[]);
mixpanel.init("9659875b92ba8fa639ba476aedbb73b9");

function addEvent(obj, evType, fn, useCapture){
if (obj.addEventListener){
obj.addEventListener(evType, fn, useCapture);
return true;
} else if (obj.attachEvent){
var r = obj.attachEvent("on"+evType, fn);
return r;
}
}

addEvent(window, "load", function(){new FoolVisualSciences();})
addEvent(window, "load", function(){new PickAd();})

var themeName = 'dailyfinance.com';
var _gaq = _gaq || [];
_gaq.push(['_setAccount', 'UA-24928199-1']);
_gaq.push(['_trackPageview']);

(function () {

var ga = document.createElement('script');
ga.type = 'text/javascript';
ga.async = true;
ga.src = ('https:' == document.location.protocol ? 'https://ssl' : 'http://www') + '.google-analytics.com/ga.js';

var s = document.getElementsByTagName('script')[0];
s.parentNode.insertBefore(ga, s);
})();

Read | Permalink | Email this | Linking Blogs | Comments

…read more
Source: FULL ARTICLE at DailyFinance

Fed Estimates GDP Growth 2.3%-2.8% for 2013

By Justin Loiseau, The Motley Fool

Filed under:

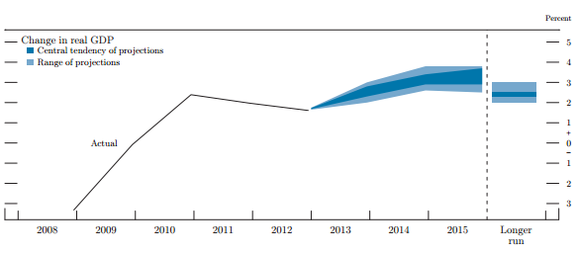
Following the Fed’s remarks today on the state of the economy, the Committee released a report [link opens a PDF] outlining economic forecasts for the next three years from board members and Federal Reserve bank presidents.

Overall, the Fed remains optimistic about our economy, which it currently describes as in a state of “moderate growth.” The Fed’s conservative estimates (excluding the three highest and three lowest projections) put GDP growth between 2.3% and 2.8% for 2013, heading as high as 3.7% by 2015, with a low estimate of 2.9% for 2015. The top of this so-called “central tendency” range for 2013 is slightly more pessimistic than the December estimate.

Source: Federal Reserve 

The unemployment rate (currently 7.7%) is expected to hit 7% or less by 2014, according to the estimates released today, with longer-run equilibrium leveling at 5.2% to 6.0%. The Fed describes the longer-run projections as the rates “to which a policymaker expects the economy to converge over time — maybe in five or six years — in the absence of further shocks and under appropriate monetary policy.”   

Inflation rates remain relatively under control, and personal consumption expenditures (PCE) inflation should be 1.7% to 2.0% (the Fed’s long-term target) in 2015.

link

The article Fed Estimates GDP Growth 2.3%-2.8% for 2013 originally appeared on Fool.com.

Y
ou can follow Justin Loiseau on Twitter, @TMFJLo, and on Motley Fool CAPS, @TMFJLo.
Try any of our Foolish newsletter services free for 30 days. We Fools may not all hold the same opinions, but we all believe that considering a diverse range of insights makes us better investors. The Motley Fool has a disclosure policy.

Copyright © 1995 – 2013 The Motley Fool, LLC. All rights reserved. The Motley Fool has a disclosure policy.

(function(c,a){window.mixpanel=a;var b,d,h,e;b=c.createElement(“script”);
b.type=”text/javascript”;b.async=!0;b.src=(“https:”===c.location.protocol?”https:”:”http:”)+
‘//cdn.mxpnl.com/libs/mixpanel-2.2.min.js’;d=c.getElementsByTagName(“script”)[0];
d.parentNode.insertBefore(b,d);a._i=[];a.init=function(b,c,f){function d(a,b){
var c=b.split(“.”);2==c.length&&(a=a[c[0]],b=c[1]);a[b]=function(){a.push([b].concat(
Array.prototype.slice.call(arguments,0)))}}var g=a;”undefined”!==typeof f?g=a[f]=[]:
f=”mixpanel”;g.people=g.people||[];h=[‘disable’,’track’,’track_pageview’,’track_links’,
‘track_forms’,’register’,’register_once’,’unregister’,’identify’,’alias’,’name_tag’,
‘set_config’,’people.set’,’people.increment’];for(e=0;e<h.length;e++)d(g,h[e]);
a._i.push([b,c,f])};a.__SV=1.2;})(document,window.mixpanel||[]);
mixpanel.init("9659875b92ba8fa639ba476aedbb73b9");

function addEvent(obj, evType, fn, useCapture){
if (obj.addEventListener){
obj.addEventListener(evType, fn, useCapture);
return true;
} else if (obj.attachEvent){
var r = obj.attachEvent("on"+evType, fn);
return r;
}
}

addEvent(window, "load", function(){new FoolVisualSciences();})
addEvent(window, "load", function(){new PickAd();})

var themeName = 'dailyfinance.com';
var _gaq = _gaq || [];
_gaq.push(['_setAccount', 'UA-24928199-1']);
_gaq.push(['_trackPageview']);

(function () {

var ga = document.createElement('script');
ga.type = 'text/javascript';
ga.async = true;
…read more
Source: FULL ARTICLE at DailyFinance

Toxic water contamination at North Carolina military base dates back to 1948, report says

Drinking water contamination at North Carolina‘s sprawling Camp Lejeune military base could date to 1948, five years earlier than researchers had reported previously, a federal report indicates.

The Agency for Toxic Substances and Disease Registry plans to release a report Friday on the contamination that has led to a long-running dispute between former residents and the Marines Corps.

TCE, an industrial solvent now known as a human carcinogen, likely first exceeded the maximum contaminant level in August 1953, but evidence shows its presence in the water supply might date as far back as November 1948, the report states. A copy of the report was obtained Thursday by The Associated Press.

“Basically, it’s vindication and confirmation for what I’ve been saying for nearly 16 years,” said retired Marine Master Sgt. Jerry Ensminger, a leader in a protracted fight for information about the contamination. “The truth is finally coming out.”

Ensminger blames the contamination for the leukemia that killed his 9-year-old daughter, Janey, in 1985. Marines and family members have blamed the contamination for many kinds of cancers, including breast cancer in men and women, bladder cancer and liver cancer.

Wells at the base were contaminated by fuel leaks and other sources of pollution before being closed three decades ago. Health officials have said they think as many as 1 million people may have been exposed to tainted water. Tests done in the early 1980s showed that water at a base treatment plant was “highly contaminated” with chlorinated hydrocarbons.

The federal agency had initially set 1953 as the date for the earliest known contamination in a letter written in January to the Department of Veterans Affairs. In that letter, the agency said computer modeling showed drinking water in the residential area called Hadnot Point was unsafe for human consumption as far back as that year.

That was still four years earlier than Marines and their dependents can secure health care and screening for illnesses related to the water. President Barack Obama signed a law last year granting health care and screening to Marines and their dependents on the base between 1957 and 1987.

This week, Sen. Richard Burr filed to extend coverage back to 1953.

The report lays out levels at the Hadnot Point and Holcomb Boulevard water treatment plants on base for various contaminants, including TCE, PCE, vinyl chloride and benzene. All those chemicals are classified as causing or probably causing cancer. It also includes one other chemical that’s not carcinogenic.

For TCE, the maximum level of 783 parts per billion was reached in November 1983 at Hadnot; at Holcomb it was 66 ppb in February 1985, the report says. The highest level allowed in drinking water is 5 ppb, set in 1989, meaning the Hadnot Point level was almost 157 times the highest level allowed now.

The Hadnot plant opened in 1942 and the second plant in the early 70s.

Until the summer of 1972, the Hadnot treatment plant supplied all finished water distributed to bachelor and family housing units, the report says. It noted that the Holcomb Bouelvard plant came online …read more
Source: FULL ARTICLE at Fox US News