Tag Archives: GAAP

Strayer Education Earnings Are on Deck

By Seth Jayson, The Motley Fool

Filed under:

Strayer Education (NAS: STRA) is expected to report Q1 earnings on May 2. Here’s what Wall Street wants to see:

The 10-second takeaway
Comparing the upcoming quarter to the prior-year quarter, average analyst estimates predict Strayer Education‘s revenues will wane -6.7% and EPS will contract -30.1%.

The average estimate for revenue is $139.6 million. On the bottom line, the average EPS estimate is $1.46.

Revenue details
Last quarter, Strayer Education reported revenue of $141.9 million. GAAP reported sales were 8.9% lower than the prior-year quarter’s $155.8 million.

Source: S&P Capital IQ. Quarterly periods. Dollar amounts in millions. Non-GAAP figures may vary to maintain comparability with estimates.

EPS details
Last quarter, EPS came in at $1.47. GAAP EPS of $1.47 for Q4 were 36% lower than the prior-year quarter’s $2.31 per share.

Source: S&P Capital IQ. Quarterly periods. Non-GAAP figures may vary to maintain comparability with estimates.

Recent performance
For the preceding quarter, gross margin was 45.3%, 820 basis points worse than the prior-year quarter. Operating margin was 20.2%, 890 basis points worse than the prior-year quarter. Net margin was 11.7%, 540 basis points worse than the prior-year quarter.

Looking ahead

The full year’s average estimate for revenue is $529.9 million. The average EPS estimate is $4.06.

Investor sentiment
The stock has a two-star rating (out of five) at Motley Fool CAPS, with 251 members out of 318 rating the stock outperform, and 67 members rating it underperform. Among 82 CAPS All-Star picks (recommendations by the highest-ranked CAPS members), 66 give Strayer Education a green thumbs-up, and 16 give it a red thumbs-down.

Of Wall Street recommendations tracked by S&P Capital IQ, the average opinion on Strayer Education is hold, with an average price target of $53.17.

Looking for alternatives to Strayer Education? It takes more than great companies to build a fortune for the future. Learn the basic financial habits of millionaires next door and get focused stock ideas in our free report, “3 Stocks That Will Help You Retire Rich.” Click here for instant access to this free report.

The article Strayer Education Earnings Are on Deck originally appeared on Fool.com.


Seth Jayson had no position in any company mentioned here at the time of publication. You can view his stock holdings here. He is co-advisor of
Motley Fool Hidden Gems, which provides new small-cap ideas every month, backed by a real-money portfolio. The Motley Fool has no position in any of the

Source: FULL ARTICLE at DailyFinance

Will These Numbers from Blue Nile Be Good Enough for You?

By Seth Jayson, The Motley Fool

Filed under:

Blue Nile (NAS: NILE) is expected to report Q1 earnings on May 2. Here’s what Wall Street wants to see:

The 10-second takeaway
Comparing the upcoming quarter to the prior-year quarter, average analyst estimates predict Blue Nile‘s revenues will grow 16.6% and EPS will grow 500.0%.

The average estimate for revenue is $96.9 million. On the bottom line, the average EPS estimate is $0.06.

Revenue details
Last quarter, Blue Nile notched revenue of $136.1 million. GAAP reported sales were 21% higher than the prior-year quarter’s $112.3 million.

Source: S&P Capital IQ. Quarterly periods. Dollar amounts in millions. Non-GAAP figures may vary to maintain comparability with estimates.

EPS details
Last quarter, EPS came in at $0.39. GAAP EPS of $0.39 for Q4 were 30% higher than the prior-year quarter’s $0.30 per share.

Source: S&P Capital IQ. Quarterly periods. Non-GAAP figures may vary to maintain comparability with estimates.

Recent performance
For the preceding quarter, gross margin was 18.9%, 180 basis points worse than the prior-year quarter. Operating margin was 5.2%, 40 basis points worse than the prior-year quarter. Net margin was 3.6%, 20 basis points worse than the prior-year quarter.

Looking ahead

The full year’s average estimate for revenue is $455.3 million. The average EPS estimate is $0.80.

Investor sentiment
The stock has a two-star rating (out of five) at Motley Fool CAPS, with 635 members out of 833 rating the stock outperform, and 198 members rating it underperform. Among 264 CAPS All-Star picks (recommendations by the highest-ranked CAPS members), 207 give Blue Nile a green thumbs-up, and 57 give it a red thumbs-down.

Of Wall Street recommendations tracked by S&P Capital IQ, the average opinion on Blue Nile is hold, with an average price target of $41.44.

Looking for alternatives to Blue Nile? It takes more than great companies to build a fortune for the future. Learn the basic financial habits of millionaires next door and get focused stock ideas in our free report, “3 Stocks That Will Help You Retire Rich.” Click here for instant access to this free report.

The article Will These Numbers from Blue Nile Be Good Enough for You? originally appeared on Fool.com.


Seth Jayson had no position in any company mentioned here at the time of publication. You can view his stock holdings here. He is co-advisor of
Motley Fool Hidden Gems, which provides new small-cap ideas every month, backed by a real-money portfolio. The Motley Fool recommends Blue

Source: FULL ARTICLE at DailyFinance

Will These Numbers from Nektar Therapeutics Be Good Enough for You?

By Seth Jayson, The Motley Fool

Filed under:

Nektar Therapeutics (NAS: NKTR) is expected to report Q1 earnings around May 1. Here’s what Wall Street wants to see:

The 10-second takeaway
Comparing the upcoming quarter to the prior-year quarter, average analyst estimates predict Nektar Therapeutics‘s revenues will expand 53.3% and EPS will remain in the red.

The average estimate for revenue is $27.5 million. On the bottom line, the average EPS estimate is -$0.43.

Revenue details
Last quarter, Nektar Therapeutics reported revenue of $21.1 million. GAAP reported sales were 34% higher than the prior-year quarter’s $15.8 million.

Source: S&P Capital IQ. Quarterly periods. Dollar amounts in millions. Non-GAAP figures may vary to maintain comparability with estimates.

EPS details
Last quarter, EPS came in at -$0.46. GAAP EPS were -$0.46 for Q4 compared to -$0.33 per share for the prior-year quarter.

Source: S&P Capital IQ. Quarterly periods. Non-GAAP figures may vary to maintain comparability with estimates.

Recent performance
For the preceding quarter, gross margin was 65.5%, much about the same as the prior-year quarter. Operating margin was -205.1%, 380 basis points worse than the prior-year quarter. Net margin was -250.3%, much worse than the prior-year quarter.

Looking ahead

The full year’s average estimate for revenue is $202.6 million. The average EPS estimate is -$1.05.

Investor sentiment
The stock has a two-star rating (out of five) at Motley Fool CAPS, with 195 members out of 223 rating the stock outperform, and 28 members rating it underperform. Among 52 CAPS All-Star picks (recommendations by the highest-ranked CAPS members), 40 give Nektar Therapeutics a green thumbs-up, and 12 give it a red thumbs-down.

Of Wall Street recommendations tracked by S&P Capital IQ, the average opinion on Nektar Therapeutics is outperform, with an average price target of $11.29.

The article Will These Numbers from Nektar Therapeutics Be Good Enough for You? originally appeared on Fool.com.


Seth Jayson had no position in any company mentioned here at the time of publication. You can view his stock holdings here. He is co-advisor of
Motley Fool Hidden Gems, which provides new small-cap ideas every month, backed by a real-money portfolio. The Motley Fool has no position in any of the stocks mentioned. Try any of our Foolish newsletter services free for 30 days. We Fools may not all hold the same opinions, but we all believe that considering a diverse range of insights makes us better investors. The Motley Fool has a disclosure policy.

Copyright © 1995 –

Source: FULL ARTICLE at DailyFinance

Are You Expecting This from Liquidity Services?

By Seth Jayson, The Motley Fool

Filed under:

Liquidity Services (NAS: LQDT) is expected to report Q2 earnings on May 2. Here’s what Wall Street wants to see:

The 10-second takeaway
Comparing the upcoming quarter to the prior-year quarter, average analyst estimates predict Liquidity Services‘s revenues will grow 12.1% and EPS will wane -2.0%.

The average estimate for revenue is $140.9 million. On the bottom line, the average EPS estimate is $0.48.

Revenue details
Last quarter, Liquidity Services booked revenue of $122.2 million. GAAP reported sales were 15% higher than the prior-year quarter’s $106.0 million.

Source: S&P Capital IQ. Quarterly periods. Dollar amounts in millions. Non-GAAP figures may vary to maintain comparability with estimates.

EPS details
Last quarter, non-GAAP EPS came in at $0.41. GAAP EPS of $0.20 for Q1 were 29% lower than the prior-year quarter’s $0.28 per share.

Source: S&P Capital IQ. Quarterly periods. Non-GAAP figures may vary to maintain comparability with estimates.

Recent performance
For the preceding quarter, gross margin was 43.0%, 130 basis points worse than the prior-year quarter. Operating margin was 12.8%, 280 basis points worse than the prior-year quarter. Net margin was 5.5%, 310 basis points worse than the prior-year quarter.

Looking ahead

The full year’s average estimate for revenue is $544.2 million. The average EPS estimate is $1.97.

Investor sentiment
The stock has a five-star rating (out of five) at Motley Fool CAPS, with 523 members out of 548 rating the stock outperform, and 25 members rating it underperform. Among 151 CAPS All-Star picks (recommendations by the highest-ranked CAPS members), 147 give Liquidity Services a green thumbs-up, and four give it a red thumbs-down.

Of Wall Street recommendations tracked by S&P Capital IQ, the average opinion on Liquidity Services is buy, with an average price target of $57.85.

Internet software and services are being consumed in radically different ways, on new and increasingly mobile devices. Is Liquidity Services on the right side of the revolution? Check out the changing landscape and meet the company that Motley Fool analysts expect to lead “The Next Trillion-dollar Revolution.” Click here for instant access to this free report.

The article Are You Expecting This from Liquidity Services? originally appeared on Fool.com.


Seth Jayson had no position in any company mentioned here at the time of publication. You can view his stock holdings here. He is co-advisor of
Motley Fool Hidden Gems, which provides new small-cap ideas every month, backed by a real-money portfolio. The Motley Fool recommends Liquidity Services.

Source: FULL ARTICLE at DailyFinance

Does The Street Have Zoltek Companies Figured Out?

By Seth Jayson, The Motley Fool

Filed under:

Zoltek Companies (NAS: ZOLT) is expected to report Q2 earnings around May 1. Here’s what Wall Street wants to see:

The 10-second takeaway
Comparing the upcoming quarter to the prior-year quarter, average analyst estimates predict Zoltek Companies‘s revenues will wane -20.2% and EPS will contract 0.0%.

The average estimate for revenue is $37.5 million. On the bottom line, the average EPS estimate is $0.10.

Revenue details
Last quarter, Zoltek Companies reported revenue of $35.9 million. GAAP reported sales were 24% lower than the prior-year quarter’s $47.0 million.

Source: S&P Capital IQ. Quarterly periods. Dollar amounts in millions. Non-GAAP figures may vary to maintain comparability with estimates.

EPS details
Last quarter, EPS came in at $0.09. GAAP EPS of $0.09 for Q1 were 68% lower than the prior-year quarter’s $0.28 per share.

Source: S&P Capital IQ. Quarterly periods. Non-GAAP figures may vary to maintain comparability with estimates.

Recent performance
For the preceding quarter, gross margin was 25.3%, 270 basis points worse than the prior-year quarter. Operating margin was 10.2%, 720 basis points worse than the prior-year quarter. Net margin was 8.3%, much worse than the prior-year quarter.

Looking ahead

The full year’s average estimate for revenue is $156.4 million. The average EPS estimate is $0.44.

Investor sentiment
The stock has a four-star rating (out of five) at Motley Fool CAPS, with 721 members out of 765 rating the stock outperform, and 44 members rating it underperform. Among 140 CAPS All-Star picks (recommendations by the highest-ranked CAPS members), 127 give Zoltek Companies a green thumbs-up, and 13 give it a red thumbs-down.

Of Wall Street recommendations tracked by S&P Capital IQ, the average opinion on Zoltek Companies is hold, with an average price target of $8.50.

The rich are different than you and me: They might not notice the moneymaking stories right under our noses. In our new report, “Middle-Class Millionaire-Makers: 3 Stocks Wall Street‘s Too Rich to Notice,” we give you three Peter Lynch-inspired buy-what-you-know stocks for the 99%. Click here for instant access to this free report.

The article Does The Street Have Zoltek Companies Figured Out? originally appeared on Fool.com.


Seth Jayson had no position in any company mentioned here at the time of publication. You can view his stock holdings here. He is co-advisor of
Motley Fool Hidden Gems, which provides new small-cap ideas every month, backed by a real-money portfolio. The Motley Fool has no position in any of the stocks

Source: FULL ARTICLE at DailyFinance

Are You Expecting This from NCR?

By Seth Jayson, The Motley Fool

Filed under:

NCR (NYS: NCR) is expected to report Q1 earnings on April 30. Here’s what Wall Street wants to see:

The 10-second takeaway
Comparing the upcoming quarter to the prior-year quarter, average analyst estimates predict NCR‘s revenues will increase 7.2% and EPS will wane -8.5%.

The average estimate for revenue is $1.33 billion. On the bottom line, the average EPS estimate is $0.43.

Revenue details
Last quarter, NCR recorded revenue of $1.64 billion. GAAP reported sales were 2.6% higher than the prior-year quarter’s $1.60 billion.

Source: S&P Capital IQ. Quarterly periods. Dollar amounts in millions. Non-GAAP figures may vary to maintain comparability with estimates.

EPS details
Last quarter, non-GAAP EPS came in at $0.72. GAAP EPS were -$0.13 for Q4 against -$0.06 per share for the prior-year quarter.

Source: S&P Capital IQ. Quarterly periods. Non-GAAP figures may vary to maintain comparability with estimates.

Recent performance
For the preceding quarter, gross margin was 27.5%, 380 basis points better than the prior-year quarter. Operating margin was 7.5%, 110 basis points better than the prior-year quarter. Net margin was -1.2%, 60 basis points worse than the prior-year quarter.

Looking ahead

The full year’s average estimate for revenue is $6.31 billion. The average EPS estimate is $2.71.

Investor sentiment
The stock has a three-star rating (out of five) at Motley Fool CAPS, with 268 members out of 293 rating the stock outperform, and 25 members rating it underperform. Among 80 CAPS All-Star picks (recommendations by the highest-ranked CAPS members), 73 give NCR a green thumbs-up, and seven give it a red thumbs-down.

Of Wall Street recommendations tracked by S&P Capital IQ, the average opinion on NCR is outperform, with an average price target of $26.29.

Looking to profit from the makers of computer hardware? You may be missing something obvious about where the money will be made in the tech industry of the future. Is NCR on the right side of the revolution? Check out the changing landscape and meet the company that Motley Fool analysts expect to lead “The Next Trillion-dollar Revolution.” Click here for instant access to this free report.

The article Are You Expecting This from NCR? originally appeared on Fool.com.


Seth Jayson had no position in any company mentioned here at the time of publication. You can view his stock holdings here. He is co-advisor of
Motley Fool Hidden Gems, which provides new small-cap ideas every month, backed by a real-money portfolio. The Motley Fool has

Source: FULL ARTICLE at DailyFinance

Coming Soon: Cameco Earnings

By Seth Jayson, The Motley Fool

Filed under:

Cameco (NYS: CCJ) is expected to report Q1 earnings on May 1. Here’s what Wall Street wants to see:

The 10-second takeaway
Comparing the upcoming quarter to the prior-year quarter, average analyst estimates predict Cameco’s revenues will contract -18.0% and EPS will compress -71.0%.

The average estimate for revenue is $462.7 million. On the bottom line, the average EPS estimate is $0.09.

Revenue details
Last quarter, Cameco notched revenue of $961.1 million. GAAP reported sales were 0.7% higher than the prior-year quarter’s $954.8 million.

Source: S&P Capital IQ. Quarterly periods. Dollar amounts in millions. Non-GAAP figures may vary to maintain comparability with estimates.

EPS details
Last quarter, non-GAAP EPS came in at $0.60. GAAP EPS of $0.11 for Q4 were 83% lower than the prior-year quarter’s $0.66 per share.

Source: S&P Capital IQ. Quarterly periods. Non-GAAP figures may vary to maintain comparability with estimates.

Recent performance
For the preceding quarter, gross margin was 44.3%, 360 basis points worse than the prior-year quarter. Operating margin was 23.6%, 400 basis points worse than the prior-year quarter. Net margin was 4.7%, much worse than the prior-year quarter.

Looking ahead

The full year’s average estimate for revenue is $2.67 billion. The average EPS estimate is $1.16.

Investor sentiment
The stock has a four-star rating (out of five) at Motley Fool CAPS, with 1,788 members out of 1,833 rating the stock outperform, and 45 members rating it underperform. Among 290 CAPS All-Star picks (recommendations by the highest-ranked CAPS members), 281 give Cameco a green thumbs-up, and nine give it a red thumbs-down.

Of Wall Street recommendations tracked by S&P Capital IQ, the average opinion on Cameco is outperform, with an average price target of $24.58.

Is Cameco the right energy stock for you? Read about a handful of timely, profit-producing plays on expensive crude in “3 Stocks for $100 Oil.” Click here for instant access to this free report.

The article Coming Soon: Cameco Earnings originally appeared on Fool.com.


Seth Jayson had no position in any company mentioned here at the time of publication. You can view his stock holdings here. He is co-advisor of
Motley Fool Hidden Gems, which provides new small-cap ideas every month, backed by a real-money portfolio. The Motley Fool has no position in any of the stocks mentioned. Try any of our Foolish newsletter services free for 30 days. We Fools may not all hold the same opinions, but we all believe that <a target=_blank

Source: FULL ARTICLE at DailyFinance

It's Showtime for Optimer Pharmaceuticals

By Seth Jayson, The Motley Fool

Filed under:

Optimer Pharmaceuticals (NAS: OPTR) is expected to report Q1 earnings around May 3. Here’s what Wall Street wants to see:

The 10-second takeaway
Comparing the upcoming quarter to the prior-year quarter, average analyst estimates predict Optimer Pharmaceuticals‘s revenues will expand 48.1% and EPS will remain in the red.

The average estimate for revenue is $21.3 million. On the bottom line, the average EPS estimate is -$0.46.

Revenue details
Last quarter, Optimer Pharmaceuticals booked revenue of $19.5 million. GAAP reported sales were 70% lower than the prior-year quarter’s $64.6 million.

Source: S&P Capital IQ. Quarterly periods. Dollar amounts in millions. Non-GAAP figures may vary to maintain comparability with estimates.

EPS details
Last quarter, EPS came in at $0.02. GAAP EPS of $0.02 for Q4 were 93% lower than the prior-year quarter’s $0.28 per share.

Source: S&P Capital IQ. Quarterly periods. Non-GAAP figures may vary to maintain comparability with estimates.

Recent performance
For the preceding quarter, gross margin was 84.5%, 900 basis points worse than the prior-year quarter. Operating margin was -155.4%, much worse than the prior-year quarter. Net margin was 5.1%, much worse than the prior-year quarter.

Looking ahead

The full year’s average estimate for revenue is $99.7 million. The average EPS estimate is -$1.83.

Investor sentiment
The stock has a one-star rating (out of five) at Motley Fool CAPS, with 106 members out of 146 rating the stock outperform, and 40 members rating it underperform. Among 45 CAPS All-Star picks (recommendations by the highest-ranked CAPS members), 30 give Optimer Pharmaceuticals a green thumbs-up, and 15 give it a red thumbs-down.

Of Wall Street recommendations tracked by S&P Capital IQ, the average opinion on Optimer Pharmaceuticals is outperform, with an average price target of $16.56.

The article It’s Showtime for Optimer Pharmaceuticals originally appeared on Fool.com.


Seth Jayson had no position in any company mentioned here at the time of publication. You can view his stock holdings here. He is co-advisor of
Motley Fool Hidden Gems, which provides new small-cap ideas every month, backed by a real-money portfolio. The Motley Fool has no position in any of the stocks mentioned. Try any of our Foolish newsletter services free for 30 days. We Fools may not all hold the same opinions, but we all believe that considering a diverse range of insights makes us better investors. The Motley Fool has a disclosure policy.

Copyright © 1995 – 2013 The Motley Fool, LLC. All

Source: FULL ARTICLE at DailyFinance

What Does Wall Street See for Leap Wireless International's Q1?

By Seth Jayson, The Motley Fool

Filed under:

Leap Wireless International (NAS: LEAP) is expected to report Q1 earnings on April 30. Here’s what Wall Street wants to see:

The 10-second takeaway
Comparing the upcoming quarter to the prior-year quarter, average analyst estimates predict Leap Wireless International‘s revenues will contract -11.2% and EPS will remain in the red.

The average estimate for revenue is $733.1 million. On the bottom line, the average EPS estimate is -$1.19.

Revenue details
Last quarter, Leap Wireless International logged revenue of $756.0 million. GAAP reported sales were 1.5% lower than the prior-year quarter’s $767.4 million.

Source: S&P Capital IQ. Quarterly periods. Dollar amounts in millions. Non-GAAP figures may vary to maintain comparability with estimates.

EPS details
Last quarter, non-GAAP EPS came in at -$1.71. GAAP EPS were -$0.96 for Q4 versus -$1.10 per share for the prior-year quarter.

Source: S&P Capital IQ. Quarterly periods. Non-GAAP figures may vary to maintain comparability with estimates.

Recent performance
For the preceding quarter, gross margin was 41.4%, 130 basis points better than the prior-year quarter. Operating margin was -2.2%, 100 basis points worse than the prior-year quarter. Net margin was -9.8%, 120 basis points better than the prior-year quarter.

Looking ahead

The full year’s average estimate for revenue is $2.77 billion. The average EPS estimate is -$4.61.

Investor sentiment
The stock has a two-star rating (out of five) at Motley Fool CAPS, with 185 members out of 238 rating the stock outperform, and 53 members rating it underperform. Among 47 CAPS All-Star picks (recommendations by the highest-ranked CAPS members), 37 give Leap Wireless International a green thumbs-up, and 10 give it a red thumbs-down.

Of Wall Street recommendations tracked by S&P Capital IQ, the average opinion on Leap Wireless International is hold, with an average price target of $5.73.

Is Leap Wireless International the best telecom bet for you? Learn how to maximize your investment income and “Secure Your Future With 9 Rock-Solid Dividend Stocks,” including one above-average telecom company. Click here for instant access to this free report.

The article What Does Wall Street See for Leap Wireless International’s Q1? originally appeared on Fool.com.


Seth Jayson had no position in any company mentioned here at the time of publication. You can view his stock holdings here. He is co-advisor of
Motley Fool Hidden Gems, which provides new small-cap ideas every month, backed by a real-money portfolio. The Motley Fool has no position in any of the stocks mentioned. Try

Source: FULL ARTICLE at DailyFinance

Will Arkansas Best Beat These Analyst Estimates?

By Seth Jayson, The Motley Fool

Filed under:

Arkansas Best (NAS: ABFS) is expected to report Q1 earnings on April 30. Here’s what Wall Street wants to see:

The 10-second takeaway
Comparing the upcoming quarter to the prior-year quarter, average analyst estimates predict Arkansas Best‘s revenues will grow 17.4% and EPS will remain in the red.

The average estimate for revenue is $517.5 million. On the bottom line, the average EPS estimate is -$0.39.

Revenue details
Last quarter, Arkansas Best reported revenue of $537.0 million. GAAP reported sales were 16% higher than the prior-year quarter’s $463.2 million.

Source: S&P Capital IQ. Quarterly periods. Dollar amounts in millions. Non-GAAP figures may vary to maintain comparability with estimates.

EPS details
Last quarter, non-GAAP EPS came in at -$0.22. GAAP EPS were -$0.31 for Q4 compared to $0.05 per share for the prior-year quarter.

Source: S&P Capital IQ. Quarterly periods. Non-GAAP figures may vary to maintain comparability with estimates.

Recent performance
For the preceding quarter, gross margin was 4.1%, 370 basis points worse than the prior-year quarter. Operating margin was -2.1%, 260 basis points worse than the prior-year quarter. Net margin was -1.5%, 180 basis points worse than the prior-year quarter.

Looking ahead

The full year’s average estimate for revenue is $2.27 billion. The average EPS estimate is $0.35.

Investor sentiment
The stock has a three-star rating (out of five) at Motley Fool CAPS, with 109 members out of 127 rating the stock outperform, and 18 members rating it underperform. Among 36 CAPS All-Star picks (recommendations by the highest-ranked CAPS members), 31 give Arkansas Best a green thumbs-up, and five give it a red thumbs-down.

Of Wall Street recommendations tracked by S&P Capital IQ, the average opinion on Arkansas Best is hold, with an average price target of $10.00.

If you’re interested in transportation companies like Arkansas Best, then you should check out our special report that features 3 companies who depend on, and invest in, that industry. Learn the basic financial habits of millionaires next door and get these 3 focused stock ideas in our free report, “3 Stocks That Will Help You Retire Rich.” Click here for instant access to this free report.

The article Will Arkansas Best Beat These Analyst Estimates? originally appeared on Fool.com.


Seth Jayson had no position in any company mentioned here at the time of publication. You can view his stock holdings here. He is co-advisor of
Motley Fool Hidden Gems, which provides new small-cap ideas every month,

Source: FULL ARTICLE at DailyFinance

Does The Street Have UIL Holdings Figured Out?

By Seth Jayson, The Motley Fool

Filed under:

UIL Holdings (NYS: UIL) is expected to report Q1 earnings on May 2. Here’s what Wall Street wants to see:

The 10-second takeaway
Comparing the upcoming quarter to the prior-year quarter, average analyst estimates predict UIL Holdings’s revenues will expand 9.4% and EPS will increase 5.4%.

The average estimate for revenue is $501.3 million. On the bottom line, the average EPS estimate is $0.97.

Revenue details
Last quarter, UIL Holdings logged revenue of $420.8 million. GAAP reported sales were 13% higher than the prior-year quarter’s $373.6 million.

Source: S&P Capital IQ. Quarterly periods. Dollar amounts in millions. Non-GAAP figures may vary to maintain comparability with estimates.

EPS details
Last quarter, EPS came in at $0.56. GAAP EPS of $0.56 for Q4 were 37% higher than the prior-year quarter’s $0.41 per share.

Source: S&P Capital IQ. Quarterly periods. Non-GAAP figures may vary to maintain comparability with estimates.

Recent performance
For the preceding quarter, gross margin was 34.2%, 390 basis points better than the prior-year quarter. Operating margin was 16.0%, 390 basis points better than the prior-year quarter. Net margin was 6.9%, 120 basis points better than the prior-year quarter.

Looking ahead

The full year’s average estimate for revenue is $1.55 billion. The average EPS estimate is $2.18.

Investor sentiment
The stock has a five-star rating (out of five) at Motley Fool CAPS, with 70 members out of 74 rating the stock outperform, and four members rating it underperform. Among 26 CAPS All-Star picks (recommendations by the highest-ranked CAPS members), 25 give UIL Holdings a green thumbs-up, and one give it a red thumbs-down.

Of Wall Street recommendations tracked by S&P Capital IQ, the average opinion on UIL Holdings is hold, with an average price target of $36.86.

Can your portfolio provide you with enough income to last through retirement? You’ll need more than UIL Holdings. Learn how to maximize your investment income and “Secure Your Future With 9 Rock-Solid Dividend Stocks.” Click here for instant access to this free report.

The article Does The Street Have UIL Holdings Figured Out? originally appeared on Fool.com.


Seth Jayson had no position in any company mentioned here at the time of publication. You can view his stock holdings here. He is co-advisor of
Motley Fool Hidden Gems, which provides new small-cap ideas every month, backed by a real-money portfolio. The Motley Fool has no position in any of the stocks mentioned. Try any of our Foolish newsletter services

Source: FULL ARTICLE at DailyFinance
It's Showtime for Western Refining

By Seth Jayson, The Motley Fool

Filed under:

Western Refining (NYS: WNR) is expected to report Q1 earnings on May 2. Here’s what Wall Street wants to see:

The 10-second takeaway
Comparing the upcoming quarter to the prior-year quarter, average analyst estimates predict Western Refining‘s revenues will decrease -8.2% and EPS will grow 14.8%.

The average estimate for revenue is $2.15 billion. On the bottom line, the average EPS estimate is $0.93.

Revenue details
Last quarter, Western Refining notched revenue of $2.25 billion. GAAP reported sales were 1.2% lower than the prior-year quarter’s $2.28 billion.

Source: S&P Capital IQ. Quarterly periods. Dollar amounts in millions. Non-GAAP figures may vary to maintain comparability with estimates.

EPS details
Last quarter, non-GAAP EPS came in at $1.45. GAAP EPS were $1.92 for Q4 versus -$0.71 per share for the prior-year quarter.

Source: S&P Capital IQ. Quarterly periods. Non-GAAP figures may vary to maintain comparability with estimates.

Recent performance
For the preceding quarter, gross margin was 17.8%, 290 basis points worse than the prior-year quarter. Operating margin was 15.2%, 280 basis points worse than the prior-year quarter. Net margin was 9.2%, much better than the prior-year quarter.

Looking ahead

The full year’s average estimate for revenue is $9.78 billion. The average EPS estimate is $4.46.

Investor sentiment
The stock has a four-star rating (out of five) at Motley Fool CAPS, with 1,089 members out of 1,142 rating the stock outperform, and 53 members rating it underperform. Among 245 CAPS All-Star picks (recommendations by the highest-ranked CAPS members), 236 give Western Refining a green thumbs-up, and nine give it a red thumbs-down.

Of Wall Street recommendations tracked by S&P Capital IQ, the average opinion on Western Refining is outperform, with an average price target of $32.44.

Is Western Refining the right energy stock for you? Read about a handful of timely, profit-producing plays on expensive crude in “3 Stocks for $100 Oil.” Click here for instant access to this free report.

The article It’s Showtime for Western Refining originally appeared on Fool.com.


Seth Jayson had no position in any company mentioned here at the time of publication. You can view his stock holdings here. He is co-advisor of
Motley Fool Hidden Gems, which provides new small-cap ideas every month, backed by a real-money portfolio. The Motley Fool owns shares of Western Refining. Try any of our Foolish newsletter services free for 30 days. We Fools may not all hold the same opinions, but we all believe

Source: FULL ARTICLE at DailyFinance

It's Showtime for ZAGG

By Seth Jayson, The Motley Fool

Filed under:

ZAGG (NAS: ZAGG) is expected to report Q1 earnings on May 2. Here’s what Wall Street wants to see:

The 10-second takeaway
Comparing the upcoming quarter to the prior-year quarter, average analyst estimates predict ZAGG‘s revenues will grow 19.9% and EPS will expand 56.3%.

The average estimate for revenue is $66.5 million. On the bottom line, the average EPS estimate is $0.25.

Revenue details
Last quarter, ZAGG reported revenue of $87.5 million. GAAP reported sales were 29% higher than the prior-year quarter’s $67.6 million.

Source: S&P Capital IQ. Quarterly periods. Dollar amounts in millions. Non-GAAP figures may vary to maintain comparability with estimates.

EPS details
Last quarter, non-GAAP EPS came in at $0.35. GAAP EPS of $0.01 for Q4 were 97% lower than the prior-year quarter’s $0.32 per share.

Source: S&P Capital IQ. Quarterly periods. Non-GAAP figures may vary to maintain comparability with estimates.

Recent performance
For the preceding quarter, gross margin was 44.1%, 900 basis points worse than the prior-year quarter. Operating margin was 19.2%, 940 basis points worse than the prior-year quarter. Net margin was 0.2%, much worse than the prior-year quarter.

Looking ahead

The full year’s average estimate for revenue is $315.8 million. The average EPS estimate is $1.17.

Investor sentiment
The stock has a one-star rating (out of five) at Motley Fool CAPS, with 279 members out of 364 rating the stock outperform, and 85 members rating it underperform. Among 76 CAPS All-Star picks (recommendations by the highest-ranked CAPS members), 36 give ZAGG a green thumbs-up, and 40 give it a red thumbs-down.

Of Wall Street recommendations tracked by S&P Capital IQ, the average opinion on ZAGG is outperform, with an average price target of $13.68.

The rich are different than you and me: They might not notice the moneymaking stories right under our noses. In our new report, “Middle-Class Millionaire-Makers: 3 Stocks Wall Street‘s Too Rich to Notice,” we give you three Peter Lynch-inspired buy-what-you-know stocks for the 99%. Click here for instant access to this free report.

The article It’s Showtime for ZAGG originally appeared on Fool.com.


Seth Jayson had no position in any company mentioned here at the time of publication. You can view his stock holdings here. He is co-advisor of
Motley Fool Hidden Gems, which provides new small-cap ideas every month, backed by a real-money portfolio. The Motley Fool has no position in any of the stocks mentioned. Try any of our Foolish newsletter services <a target=_blank

Source: FULL ARTICLE at DailyFinance

Will Tenaris Beat These Analyst Estimates?

By Seth Jayson, The Motley Fool

Filed under:

Tenaris (NYS: TS) is expected to report Q1 earnings on May 1. Here’s what Wall Street wants to see:

The 10-second takeaway
Comparing the upcoming quarter to the prior-year quarter, average analyst estimates predict Tenaris’s revenues will expand 4.8% and EPS will shrink -1.3%.

The average estimate for revenue is $2.74 billion. On the bottom line, the average EPS estimate is $0.74.

Revenue details
Last quarter, Tenaris chalked up revenue of $2.76 billion. GAAP reported sales were 0.3% higher than the prior-year quarter’s $2.75 billion.

Source: S&P Capital IQ. Quarterly periods. Dollar amounts in millions. Non-GAAP figures may vary to maintain comparability with estimates.

EPS details
Last quarter, non-GAAP EPS came in at $0.61. GAAP EPS of $0.30 for Q4 were 12% lower than the prior-year quarter’s $0.34 per share.

Source: S&P Capital IQ. Quarterly periods. Non-GAAP figures may vary to maintain comparability with estimates.

Recent performance
For the preceding quarter, gross margin was 39.4%, 260 basis points better than the prior-year quarter. Operating margin was 21.2%, 160 basis points better than the prior-year quarter. Net margin was 13.0%, 150 basis points worse than the prior-year quarter.

Looking ahead

The full year’s average estimate for revenue is $11.44 billion. The average EPS estimate is $3.16.

Investor sentiment
The stock has a four-star rating (out of five) at Motley Fool CAPS, with 792 members out of 815 rating the stock outperform, and 23 members rating it underperform. Among 200 CAPS All-Star picks (recommendations by the highest-ranked CAPS members), 195 give Tenaris a green thumbs-up, and five give it a red thumbs-down.

Of Wall Street recommendations tracked by S&P Capital IQ, the average opinion on Tenaris is hold, with an average price target of $46.59.

Is Tenaris the right energy stock for you? Read about a handful of timely, profit-producing plays on expensive crude in “3 Stocks for $100 Oil.” Click here for instant access to this free report.

The article Will Tenaris Beat These Analyst Estimates? originally appeared on Fool.com.


Seth Jayson had no position in any company mentioned here at the time of publication. You can view his stock holdings here. He is co-advisor of
Motley Fool Hidden Gems, which provides new small-cap ideas every month, backed by a real-money portfolio. The Motley Fool has no position in any of the stocks mentioned. Try any of our Foolish newsletter services free for 30 days. We Fools may not all hold the same opinions, but

Source: FULL ARTICLE at DailyFinance

Coming Soon: Las Vegas Sands Earnings

By Seth Jayson, The Motley Fool

Filed under:

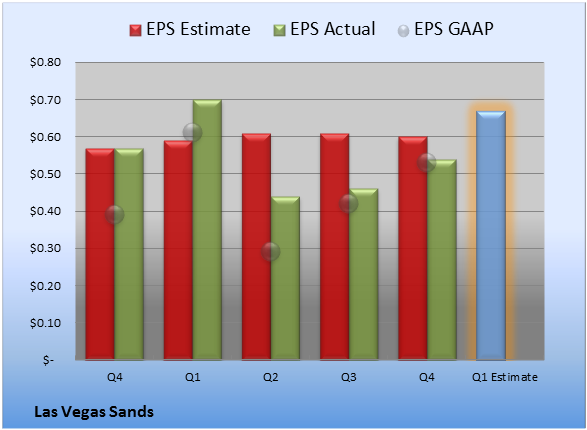
Las Vegas Sands (NYS: LVS) is expected to report Q1 earnings on May 1. Here’s what Wall Street wants to see:

The 10-second takeaway
Comparing the upcoming quarter to the prior-year quarter, average analyst estimates predict Las Vegas Sands‘s revenues will increase 18.1% and EPS will drop -4.3%.

The average estimate for revenue is $3.26 billion. On the bottom line, the average EPS estimate is $0.67.

Revenue details
Last quarter, Las Vegas Sands notched revenue of $3.23 billion. GAAP reported sales were 21% higher than the prior-year quarter’s $2.54 billion.

Source: S&P Capital IQ. Quarterly periods. Dollar amounts in millions. Non-GAAP figures may vary to maintain comparability with estimates.

EPS details
Last quarter, non-GAAP EPS came in at $0.54. GAAP EPS of $0.53 for Q4 were 36% higher than the prior-year quarter’s $0.39 per share.

Source: S&P Capital IQ. Quarterly periods. Non-GAAP figures may vary to maintain comparability with estimates.

Recent performance
For the preceding quarter, gross margin was 159.1%, 610 basis points better than the prior-year quarter. Operating margin was 21.9%, 420 basis points worse than the prior-year quarter. Net margin was 14.1%, 300 basis points worse than the prior-year quarter.

Looking ahead

The full year’s average estimate for revenue is $13.20 billion. The average EPS estimate is $2.73.

Investor sentiment
The stock has a three-star rating (out of five) at Motley Fool CAPS, with 1,822 members out of 2,135 rating the stock outperform, and 313 members rating it underperform. Among 468 CAPS All-Star picks (recommendations by the highest-ranked CAPS members), 424 give Las Vegas Sands a green thumbs-up, and 44 give it a red thumbs-down.

Of Wall Street recommendations tracked by S&P Capital IQ, the average opinion on Las Vegas Sands is outperform, with an average price target of $51.98.

Can your portfolio provide you with enough income to last through retirement? You’ll need more than Las Vegas Sands. Learn how to maximize your investment income and “Secure Your Future With 9 Rock-Solid Dividend Stocks.” Click here for instant access to this free report.

The article Coming Soon: Las Vegas Sands Earnings originally appeared on Fool.com.


Seth Jayson had no position in any company mentioned here at the time of publication. You can view his stock holdings here. He is co-advisor of
Motley Fool Hidden Gems, which provides new small-cap ideas every month, backed by a real-money portfolio. The Motley Fool has no position in any of the stocks mentioned. Try

Source: FULL ARTICLE at DailyFinance

NXP Semiconductors Issues Q2 Guidance Above Expectations

By Rich Duprey, The Motley Fool

Filed under:

Mobile-chip maker NXP Semiconductors  reported first-quarter earnings that came in ahead of top-line consensus estimates by Capital IQ analysts, and issued guidance for the full year that was above expectations.

NXP reported revenues for the three months ending on March 31 of $1.09 billion, up 11% from the same period last year, when it recorded revenues of $978 million and ahead of analysts’ expectations of $1.07 billion. The chipmaker recorded a GAAP loss $0.06 per share, but adjusted profits of $0.72, more than triple the $0.23 per share in adjusted profits it generated last year.

Guidance for the second quarter 2013, however, was expected to be in a range of $1.15 billion to $1.21 billion, with the $1.18 billion mid-range number above the $1.16 billion expectations of analysts. On the bottom line, it anticipates $0.62 to $0.70 per share, with the midrange of $0.66 ahead of Wall Street’s $0.63-per-share estimates.

Noting that its standard products segment performed more weakly than desired because of product mix, pricing pressures, and poor factory performance that resulted from a slower-than-expected recovery from its recent quality control issues, NXP CEO Richard Clemmer said, “Our strategy continues to be focused on providing unique and differentiated product solutions to enable our customers’ success, which over the longer-term should allow NXP to outpace the cyclical growth of the overall semiconductor market.”

NXP Semiconductors provides chips used in a wide range of automotive, identification, wireless infrastructure, lighting, industrial, mobile, consumer, and computing applications.

Editor’s note: The Q1 top-line consensus estimate number in this article has been updated.

link

The article NXP Semiconductors Issues Q2 Guidance Above Expectations originally appeared on Fool.com.

Fool contributor Rich Duprey has no position in any stocks mentioned. The Motley Fool recommends NXP Semiconductors. Try any of our Foolish newsletter services free for 30 days. We Fools don’t all hold the same opinions, but we all believe that considering a diverse range of insights makes us better investors. The Motley Fool has a disclosure policy.

Copyright © 1995 – 2013 The Motley Fool, LLC. All rights reserved. The Motley Fool has a disclosure policy.

(function(c,a){window.mixpanel=a;var b,d,h,e;b=c.createElement(“script”);
b.type=”text/javascript”;b.async=!0;b.src=(“https:”===c.location.protocol?”https:”:”http:”)+
‘//cdn.mxpnl.com/libs/mixpanel-2.2.min.js’;d=c.getElementsByTagName(“script”)[0];
d.parentNode.insertBefore(b,d);a._i=[];a.init=function(b,c,f){function d(a,b){
var c=b.split(“.”);2==c.length&&(a=a[c[0]],b=c[1]);a[b]=function(){a.push([b].concat(
Array.prototype.slice.call(arguments,0)))}}var g=a;”undefined”!==typeof f?g=a[f]=[]:
f=”mixpanel”;g.people=g.people||[];h=[‘disable’,’track’,’track_pageview’,’track_links’,
‘track_forms’,’register’,’register_once’,’unregister’,’identify’,’alias’,’name_tag’,
‘set_config’,’people.set’,’people.increment’];for(e=0;e<h.length;e++)d(g,h[e]);
a._i.push([b,c,f])};a.__SV=1.2;})(document,window.mixpanel||[]);
mixpanel.init("9659875b92ba8fa639ba476aedbb73b9");

function addEvent(obj, evType, fn, useCapture){
if (obj.addEventListener){
obj.addEventListener(evType, fn, useCapture);
return true;
} else if (obj.attachEvent){
var r = obj.attachEvent("on"+evType, fn);

Source: FULL ARTICLE at DailyFinance

Cloudy Outlook For F5 Ahead Of Earnings Report

By Zacks.com, Contributor

, a leading provider of integrated Internet traffic and content management solutions, pre-announced negative results and guidance last week ahead of its April 24 earnings report. This surprise for investors caused shares to gap down 20% from $90 to $72 on April 5, trading over 12 million shares in the drop, nearly 8X the average daily volume. For second quarter, F5 now expects revenues to be $350.2 million, significantly down from previously expected range of $370-$380 million. Management blamed slowing sales in North America and Europe, Middle East and Africa for the dismal performance. From end market viewpoint, soft Telco and U.S. Federal bookings hampered revenue growth. Lower revenues have also pulled down earnings per share expectations. F5 now expects GAAP earnings per share in the range of 79-80 cents, down from previously expected range of 93-96 cents. Non-GAAP earnings are expected to be within $1.06 and $1.07 per share, down from prior expectation range of $1.21-$1.24. In its earnings call, F5 expressed its concern about the macro uncertainties that could affect near-term fundamentals. Management also remained concerned about an expected budget cut from telecom customers. Slashing the Estimates Wall Street analysts who cover the company wasted no time in the past few days “adjusting” their revenue and EPS projections. The lowering of estimates was sufficiently deep and widespread to kick FFIV down to a Zacks #4 Rank (Sell) last week and then to a #5 (Strong Sell) this week. Since a good picture can tell even a bad story quickly, below is the Zacks proprietary Price & Consensus chart, which plots annual earnings estimates against stock price. You can see the immediate hit that the already-flat-lined 2013 and 2014 estimates took on the company’s news. The kinks downward in those lines represent full-year EPS cuts of at least 11% for each. F5 hardware and systems are designed to improve the availability and performance of mission-critical Internet-based servers and applications. Its products monitor and manage local and geographically dispersed servers and intelligently direct traffic to the server best able to handle a user’s request. Its primary goal is to help prevent system failure and provide timely responses to user requests and data flow. Special Offer: After a big drop, Apple’s valuation and dividend yield look tempting. Time to buy? Click here for a free-trial and immediate access to Forbes Dividend Investor advisory service. One area of expansion is in the field of “software-defined networking” (SDN) is an approach to networking in which control moves from hardware to a software application called a controller. A network administrator uses these controllers to direct and regulate network traffic from a centralized hub. This minimizes the use of different and expensive switches for controlling Web-trafficking and helps in uninterrupted traffic flow. Another important factor for choosing SDN technology is that it is applicable for both private and public cloud infrastructures. The SDN approach to networking is gaining popularity among key networking players such as , and Brocade . While F5 is a key player

From: http://www.forbes.com/sites/zacks/2013/04/18/cloudy-outlook-for-f5-ahead-of-earnings-report/

Rogers Corporation Updates Guidance for the First Quarter

By Business Wirevia The Motley Fool

Filed under:

Rogers Corporation Updates Guidance for the First Quarter

ROGERS, Conn.–(BUSINESS WIRE)– Rogers Corporation (NYS: ROG) (“Rogers” or the “Company”) today announced revised guidance for its fiscal first quarter ended March 31, 2013. Rogers now projects first quarter net sales from continuing operations of approximately $126 million compared to the February 19, 2013 guidance of $129 to $133 million. The GAAP earnings per diluted share from continuing operations for the first quarter 2013 are expected to be approximately $0.39 per share. These per share estimates include anticipated net special adjustments of approximately $0.05 per diluted share during the quarter. Excluding these charges, non-GAAP earnings per diluted share from continuing operations are expected to be $0.44 compared to the previous non-GAAP guidance of $0.57 to $0.61 per diluted share. The first quarter results were primarily impacted by lower demand and lower production absorption in the quarter, as well as start-up costs associated with the installation of the new molded urethane foam manufacturing line.

The special adjustments are comprised of:

  • $0.7 million of pre-tax charges related to severance costs associated with workforce reductions during the quarter. This charge impacts Selling General & Administrative expenses (SG&A).
  • $0.5 million of pre-tax charges primarily associated with moving the final inspection operation for Curamik Electronics Solutions from its site in Eschenbach, Germany to Hungary. This move had been previously announced, and the costs are expensed as they are incurred. This charge also impacts SG&A.

The Company is currently working through its quarterly closing process to finalize results, which it expects to report at the end of April 2013. A table reconciling the GAAP and non-GAAP earnings amounts disclosed in this press release is included below.

Bruce D. Hoechner, President and CEO commented, “This year’s first quarter sales were up about $5.8 million or 4.8% over the first quarter of 2012, but fell slightly below the low end of our guidance for the quarter by about $3 million or 2.4%. As reported by industry sources, the quarterly reduction in global demand for tablet devices and reduced military spending impacted our first quarter results more than anticipated. However, High Performance Foams had record first quarter sales up 5.0% and our Printed Circuit Materials operating segment started the year strong with sales up 10.6%, both relative to the first quarter of 2012. We see positive signs in the markets we serve and expect market conditions to improve

From: http://www.dailyfinance.com/2013/04/18/rogers-corporation-updates-guidance-for-the-first-/

Lower Volume Hurts Philip Morris Results

By 24/7 Wall St.

Filed under: ,

Philip Morris International Inc. (NYSE: PM) reported first-quarter results before markets opened this morning. The tobacco products firm posted adjusted diluted earnings per share (EPS) of $1.29 on revenue of $7.6 billion. In the same period a year ago the company reported EPS of $1.25 on $7.45 billion in revenues. Thomson Reuters had consensus estimates for EPS of $1.34 and revenue of $7.52 billion.

On a GAAP basis, EPS totaled $1.28. The company also said that currency exchange rates cut earnings by $0.07 a share.

Cigarette shipment volume fell 6.5% year-over-year globally and by 42.5% in the Philippines, where a new excise tax cut shipments by 10 billion units. European volume fell 10.1% and Asian shipments fell 10.4%. Only the Eastern Europe, Middle East and Africa posted a gain, and that a small one of 1.4%. The company was able to make up some of the decrease by raising prices.

The company lowered its full fiscal year EPS guidance to a range of $5.55 to $5.65, compared with full-year 2012 EPS of $5.22. The forecast includes a $0.19 per share reduction due to currency exchange rates. The consensus estimate had called for full-year EPS of $5.73 on revenues of $32.37 billion.

The company’s CEO noted:

Our first quarter was relatively difficult, with our headline results marred by a number of known factors, including inventory movements, the 2012 leap year effect, currency and a slowly improving – but nevertheless substantial erosion in our – volume in the Philippines. Despite this apparent weakness, our pricing actions and market share momentum provide us with the confidence to reiterate our annual constant-currency adjusted diluted EPS growth rate target of 10-12%.

What makes tobacco companies so attractive to investors is their dividend, and Philip Morris pays a quarterly dividend of $0.85. The company repurchased 16.7 million shares of its own stock in the first quarter at a cost of $1.5 billion. Philip Morris plans to spend $18 billion on share repurchases in a three-year program that began in the third quarter of last year. So far the company has spent $4.35 billion on share buybacks.

The company’s shares closed down about 1% last night, at $94.04 and are inactive so far this morning. The stock‘s 52-week range is $81.10-$96.60. Thomson Reuters had a consensus analyst price target of around $97.60 before today’s report.

Filed under: 24/7 Wall St. Wire, Earnings, International Markets, Tobacco Tagged: PM

Read | Permalink | Email this | Linking Blogs | Comments

From: http://www.dailyfinance.com/2013/04/18/lower-volume-hurts-philip-morris-results/

WARNING: Kickstarter's Policies Cause IRS Tax Audits

By Cameron Keng, Contributor

On April 1st, 2013, Kickstarter released a “tax guide” for project creators that will lead thousands of creatives to fall under IRS tax audits as well as their contributors.  The tax guide started with the best intentions, but the execution is beyond wrong.  This is a WARNING to all Kickstarter creators and contributors to be very wary of taking any advice they provided. Dissecting Kickstarter’s Tax Guide Everything is Income It’s unfortunate the Kickstarter’s tax guide didn’t end their tax advice at the first sentence.  “In general, funds raised on Kickstarter are considered income.”  This is the beginning and end of the tax guide.  After this sentence is where the “stuff hits the fan.” Kickstarter Campaigns Are NOT Businesses In general, a creator can offset the income from their Kickstarter project with deductible expenses that are related to the project and accounted for in the same tax year. For example, if a creator receives $1,000 in funding and spends $1,000 on their project in the same tax year, then their expenses could fully offset their Kickstarter funding for federal income tax purposes. This is not true.  This statement assumes that you’re a business under tax law.  A business under the IRS’ definition has specific requirements.  The easiest test to meet the business requirements is to generate a profit for 3 years out of 5 years.  It’s very common for the IRS to go back and audit taxpayers that misclassified their activities. Accrual Method If a creator receives funding in one year and spends money on their project in a later year, consider whether their expenses can still offset their Kickstarter funding using the accrual method of accounting. Kickstarter confuses General Accepted Accounting Principles (“GAAP”) with tax lawGAAP and tax law are two entirely different accounting systems.  It’s like running Window’s on a Mac.  It might work, but it’s not pretty and everything breaks pretty fast. Note, there’s a reason why tax forms have sections called “book-to-tax differences” and check boxes that ask whether you’re applying tax basis or GAAP. Tax law requires that you pay taxes currently on advance payments and prepayments.  Tax law’s goal is make sure that everyone pays their taxes, when income or cash is received.  The IRS does not trust us to save enough money to pay our fair share of taxes months in the future.  We can’t blame the IRS’ distrust considering the United States’ average savings account balance is $3,800 dollars based on the US Census Bureau.

From: http://www.forbes.com/sites/cameronkeng/2013/04/17/warning-kickstarters-policies-cause-irs-tax-audits/