Tag Archives: Seth Jayson

Can Microchip Technology Meet These Numbers?

By Seth Jayson, The Motley Fool

Filed under:

Microchip Technology (NAS: MCHP) is expected to report Q4 earnings around May 1. Here’s what Wall Street wants to see:

The 10-second takeaway
Comparing the upcoming quarter to the prior-year quarter, average analyst estimates predict Microchip Technology‘s revenues will grow 26.0% and EPS will grow 2.2%.

The average estimate for revenue is $427.0 million. On the bottom line, the average EPS estimate is $0.47.

Revenue details
Last quarter, Microchip Technology logged revenue of $416.0 million. GAAP reported sales were 26% higher than the prior-year quarter’s $329.2 million.

Source: S&P Capital IQ. Quarterly periods. Dollar amounts in millions. Non-GAAP figures may vary to maintain comparability with estimates.

EPS details
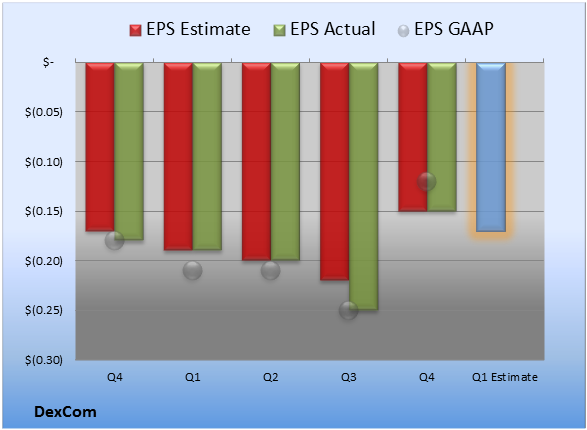
Last quarter, non-GAAP EPS came in at $0.41. GAAP EPS of $0.05 for Q3 were 87% lower than the prior-year quarter’s $0.38 per share.

Source: S&P Capital IQ. Quarterly periods. Non-GAAP figures may vary to maintain comparability with estimates.

Recent performance
For the preceding quarter, gross margin was 58.1%, 60 basis points better than the prior-year quarter. Operating margin was 14.7%, much worse than the prior-year quarter. Net margin was 2.4%, much worse than the prior-year quarter.

Looking ahead

The full year’s average estimate for revenue is $1.60 billion. The average EPS estimate is $1.84.

Investor sentiment
The stock has a five-star rating (out of five) at Motley Fool CAPS, with 306 members out of 325 rating the stock outperform, and 19 members rating it underperform. Among 96 CAPS All-Star picks (recommendations by the highest-ranked CAPS members), 95 give Microchip Technology a green thumbs-up, and one give it a red thumbs-down.

Of Wall Street recommendations tracked by S&P Capital IQ, the average opinion on Microchip Technology is outperform, with an average price target of $34.89.

Is Microchip Technology the best semiconductor stock for you? You may be missing something obvious. Check out the semiconductor company that Motley Fool analysts expect to lead “The Next Trillion-dollar Revolution.” Click here for instant access to this free report.

The article Can Microchip Technology Meet These Numbers? originally appeared on Fool.com.


Seth Jayson had no position in any company mentioned here at the time of publication. You can view his stock holdings here. He is co-advisor of
Motley Fool Hidden Gems, which provides new small-cap ideas every month, backed by a real-money portfolio. The Motley Fool has no position in any of the stocks mentioned. Try any of our Foolish newsletter services free for 30 days. We Fools may

Source: FULL ARTICLE at DailyFinance

Coming Soon: PharMerica Earnings

By Seth Jayson, The Motley Fool

Filed under:

PharMerica (NYS: PMC) is expected to report Q1 earnings on May 1. Here’s what Wall Street wants to see:

The 10-second takeaway
Comparing the upcoming quarter to the prior-year quarter, average analyst estimates predict PharMerica’s revenues will compress -12.8% and EPS will grow 13.3%.

The average estimate for revenue is $435.1 million. On the bottom line, the average EPS estimate is $0.34.

Revenue details
Last quarter, PharMerica booked revenue of $433.2 million. GAAP reported sales were 13% lower than the prior-year quarter’s $495.6 million.

Source: S&P Capital IQ. Quarterly periods. Dollar amounts in millions. Non-GAAP figures may vary to maintain comparability with estimates.

EPS details
Last quarter, non-GAAP EPS came in at $0.33. GAAP EPS of $0.13 for Q4 were 50% lower than the prior-year quarter’s $0.26 per share.

Source: S&P Capital IQ. Quarterly periods. Non-GAAP figures may vary to maintain comparability with estimates.

Recent performance
For the preceding quarter, gross margin was 17.3%, 210 basis points better than the prior-year quarter. Operating margin was 4.5%, 50 basis points better than the prior-year quarter. Net margin was 0.9%, 70 basis points worse than the prior-year quarter.

Looking ahead

The full year’s average estimate for revenue is $1.66 billion. The average EPS estimate is $1.40.

Investor sentiment
The stock has a four-star rating (out of five) at Motley Fool CAPS, with 122 members out of 128 rating the stock outperform, and six members rating it underperform. Among 20 CAPS All-Star picks (recommendations by the highest-ranked CAPS members), 18 give PharMerica a green thumbs-up, and two give it a red thumbs-down.

Of Wall Street recommendations tracked by S&P Capital IQ, the average opinion on PharMerica is outperform, with an average price target of $15.29.

Is PharMerica the best health care stock for you? Learn how to maximize your investment income and “Secure Your Future With 9 Rock-Solid Dividend Stocks,” including one above-average health care logistics company. Click here for instant access to this free report.

The article Coming Soon: PharMerica Earnings originally appeared on Fool.com.


Seth Jayson had no position in any company mentioned here at the time of publication. You can view his stock holdings here. He is co-advisor of
Motley Fool Hidden Gems, which provides new small-cap ideas every month, backed by a real-money portfolio. The Motley Fool has no position in any of the stocks mentioned. Try any of our Foolish newsletter services free for 30 days. We Fools may not all hold

Source: FULL ARTICLE at DailyFinance

Are You Expecting This from C&J Energy Services?

By Seth Jayson, The Motley Fool

Filed under:

C&J Energy Services (NYS: CJES) is expected to report Q1 earnings on May 1. Here’s what Wall Street wants to see:

The 10-second takeaway
Comparing the upcoming quarter to the prior-year quarter, average analyst estimates predict C&J Energy Services’s revenues will expand 20.4% and EPS will decrease -40.2%.

The average estimate for revenue is $287.8 million. On the bottom line, the average EPS estimate is $0.55.

Revenue details
Last quarter, C&J Energy Services booked revenue of $286.3 million. GAAP reported sales were 30% higher than the prior-year quarter’s $220.1 million.

Source: S&P Capital IQ. Quarterly periods. Dollar amounts in millions. Non-GAAP figures may vary to maintain comparability with estimates.

EPS details
Last quarter, non-GAAP EPS came in at $0.65. GAAP EPS of $0.55 for Q4 were 45% lower than the prior-year quarter’s $1.00 per share.

Source: S&P Capital IQ. Quarterly periods. Non-GAAP figures may vary to maintain comparability with estimates.

Recent performance
For the preceding quarter, gross margin was 36.7%, 930 basis points worse than the prior-year quarter. Operating margin was 19.4%, much worse than the prior-year quarter. Net margin was 10.6%, much worse than the prior-year quarter.

Looking ahead

The full year’s average estimate for revenue is $1.22 billion. The average EPS estimate is $2.34.

Investor sentiment
The stock has a five-star rating (out of five) at Motley Fool CAPS, with 220 members out of 225 rating the stock outperform, and five members rating it underperform. Among 51 CAPS All-Star picks (recommendations by the highest-ranked CAPS members), 49 give C&J Energy Services a green thumbs-up, and two give it a red thumbs-down.

Of Wall Street recommendations tracked by S&P Capital IQ, the average opinion on C&J Energy Services is outperform, with an average price target of $24.29.

Is C&J Energy Services the right energy stock for you? Read about a handful of timely, profit-producing plays on expensive crude in “3 Stocks for $100 Oil.” Click here for instant access to this free report.

The article Are You Expecting This from C&J Energy Services? originally appeared on Fool.com.


Seth Jayson had no position in any company mentioned here at the time of publication. You can view his stock holdings here. He is co-advisor of
Motley Fool Hidden Gems, which provides new small-cap ideas every month, backed by a real-money portfolio. The Motley Fool has no position in any of the stocks mentioned. Try any of our Foolish newsletter services free for 30

Source: FULL ARTICLE at DailyFinance

Are You Expecting This from WellCare Health Plans?

By Seth Jayson, The Motley Fool

Filed under:

WellCare Health Plans (NYS: WCG) is expected to report Q1 earnings around May 3. Here’s what Wall Street wants to see:

The 10-second takeaway
Comparing the upcoming quarter to the prior-year quarter, average analyst estimates predict WellCare Health Plans’s revenues will expand 21.4% and EPS will decrease -47.7%.

The average estimate for revenue is $2.17 billion. On the bottom line, the average EPS estimate is $0.69.

Revenue details
Last quarter, WellCare Health Plans chalked up revenue of $1.99 billion. GAAP reported sales were 24% higher than the prior-year quarter’s $1.60 billion.

Source: S&P Capital IQ. Quarterly periods. Dollar amounts in millions. Non-GAAP figures may vary to maintain comparability with estimates.

EPS details
Last quarter, non-GAAP EPS came in at $1.32. GAAP EPS of $1.11 for Q4 were 43% lower than the prior-year quarter’s $1.96 per share.

Source: S&P Capital IQ. Quarterly periods. Non-GAAP figures may vary to maintain comparability with estimates.

Recent performance
For the preceding quarter, gross margin was 15.2%, 560 basis points worse than the prior-year quarter. Operating margin was 3.9%, 370 basis points worse than the prior-year quarter. Net margin was 2.5%, 280 basis points worse than the prior-year quarter.

Looking ahead

The full year’s average estimate for revenue is $8.96 billion. The average EPS estimate is $4.87.

Investor sentiment
The stock has a two-star rating (out of five) at Motley Fool CAPS, with 439 members out of 481 rating the stock outperform, and 42 members rating it underperform. Among 129 CAPS All-Star picks (recommendations by the highest-ranked CAPS members), 121 give WellCare Health Plans a green thumbs-up, and eight give it a red thumbs-down.

Of Wall Street recommendations tracked by S&P Capital IQ, the average opinion on WellCare Health Plans is outperform, with an average price target of $63.30.

Is WellCare Health Plans the best health care stock for you? Learn how to maximize your investment income and “Secure Your Future With 9 Rock-Solid Dividend Stocks,” including one above-average health care logistics company. Click here for instant access to this free report.

The article Are You Expecting This from WellCare Health Plans? originally appeared on Fool.com.


Seth Jayson had no position in any company mentioned here at the time of publication. You can view his stock holdings here. He is co-advisor of
Motley Fool Hidden Gems, which provides new small-cap ideas every month, backed by a real-money portfolio. The Motley Fool has no position in any of the stocks

Source: FULL ARTICLE at DailyFinance

Coming Soon: Techne Earnings

By Seth Jayson, The Motley Fool

Filed under:

Techne (NAS: TECH) is expected to report Q3 earnings around May 2. Here’s what Wall Street wants to see:

The 10-second takeaway
Comparing the upcoming quarter to the prior-year quarter, average analyst estimates predict Techne’s revenues will increase 0.5% and EPS will shrink -1.1%.

The average estimate for revenue is $84.1 million. On the bottom line, the average EPS estimate is $0.89.

Revenue details
Last quarter, Techne reported revenue of $75.1 million. GAAP reported sales were 0.6% higher than the prior-year quarter’s $74.7 million.

Source: S&P Capital IQ. Quarterly periods. Dollar amounts in millions. Non-GAAP figures may vary to maintain comparability with estimates.

EPS details
Last quarter, non-GAAP EPS came in at $0.74. GAAP EPS of $0.69 for Q2 were 1.4% lower than the prior-year quarter’s $0.70 per share.

Source: S&P Capital IQ. Quarterly periods. Non-GAAP figures may vary to maintain comparability with estimates.

Recent performance
For the preceding quarter, gross margin was 73.6%, 30 basis points worse than the prior-year quarter. Operating margin was 49.2%, 130 basis points worse than the prior-year quarter. Net margin was 33.8%, 80 basis points worse than the prior-year quarter.

Looking ahead

The full year’s average estimate for revenue is $315.3 million. The average EPS estimate is $3.21.

Investor sentiment
The stock has a five-star rating (out of five) at Motley Fool CAPS, with 257 members out of 265 rating the stock outperform, and eight members rating it underperform. Among 73 CAPS All-Star picks (recommendations by the highest-ranked CAPS members), 73 give Techne a green thumbs-up, and give it a red thumbs-down.

Of Wall Street recommendations tracked by S&P Capital IQ, the average opinion on Techne is hold, with an average price target of $74.40.

Looking for alternatives to Techne? It takes more than great companies to build a fortune for the future. Learn the basic financial habits of millionaires next door and get focused stock ideas in our free report, “3 Stocks That Will Help You Retire Rich.” Click here for instant access to this free report.

The article Coming Soon: Techne Earnings originally appeared on Fool.com.


Seth Jayson had no position in any company mentioned here at the time of publication. You can view his stock holdings here. He is co-advisor of
Motley Fool Hidden Gems, which provides new small-cap ideas every month, backed by a real-money portfolio. The Motley Fool recommends Techne. Try any of our Foolish newsletter services free for 30 days. We Fools

Source: FULL ARTICLE at DailyFinance

Will Bankrate Beat These Analyst Estimates?

By Seth Jayson, The Motley Fool

Filed under:

Bankrate (NYS: RATE) is expected to report Q1 earnings on April 30. Here’s what Wall Street wants to see:

The 10-second takeaway
Comparing the upcoming quarter to the prior-year quarter, average analyst estimates predict Bankrate’s revenues will wane -18.1% and EPS will drop -50.0%.

The average estimate for revenue is $102.4 million. On the bottom line, the average EPS estimate is $0.09.

Revenue details
Last quarter, Bankrate reported revenue of $93.2 million. GAAP reported sales were 18% lower than the prior-year quarter’s $113.8 million.

Source: S&P Capital IQ. Quarterly periods. Dollar amounts in millions. Non-GAAP figures may vary to maintain comparability with estimates.

EPS details
Last quarter, non-GAAP EPS came in at $0.06. GAAP EPS contracted to zero from the prior-year quarter’s $0.14.

Source: S&P Capital IQ. Quarterly periods. Non-GAAP figures may vary to maintain comparability with estimates.

Recent performance
For the preceding quarter, gross margin was 67.0%, 460 basis points worse than the prior-year quarter. Operating margin was 1.3%, much worse than the prior-year quarter. Net margin was 0.4%, much worse than the prior-year quarter.

Looking ahead

The full year’s average estimate for revenue is $452.2 million. The average EPS estimate is $0.49.

Investor sentiment
The stock has a one-star rating (out of five) at Motley Fool CAPS, with 18 members out of 32 rating the stock outperform, and 14 members rating it underperform. Among 12 CAPS All-Star picks (recommendations by the highest-ranked CAPS members), five give Bankrate a green thumbs-up, and seven give it a red thumbs-down.

Of Wall Street recommendations tracked by S&P Capital IQ, the average opinion on Bankrate is outperform, with an average price target of $13.40.

Internet software and services are being consumed in radically different ways, on new and increasingly mobile devices. Is Bankrate on the right side of the revolution? Check out the changing landscape and meet the company that Motley Fool analysts expect to lead “The Next Trillion-dollar Revolution.” Click here for instant access to this free report.

The article Will Bankrate Beat These Analyst Estimates? originally appeared on Fool.com.


Seth Jayson had no position in any company mentioned here at the time of publication. You can view his stock holdings here. He is co-advisor of
Motley Fool Hidden Gems, which provides new small-cap ideas every month, backed by a real-money portfolio. The Motley Fool has no position in any of the stocks mentioned. Try any of our Foolish newsletter services free for 30 days.

Source: FULL ARTICLE at DailyFinance

Will DexCom Beat These Analyst Estimates?

By Seth Jayson, The Motley Fool

Filed under:

DexCom (NAS: DXCM) is expected to report Q1 earnings on May 1. Here’s what Wall Street wants to see:

The 10-second takeaway
Comparing the upcoming quarter to the prior-year quarter, average analyst estimates predict DexCom’s revenues will expand 40.6% and EPS will remain in the red.

The average estimate for revenue is $28.3 million. On the bottom line, the average EPS estimate is -$0.17.

Revenue details
Last quarter, DexCom logged revenue of $33.3 million. GAAP reported sales were 48% higher than the prior-year quarter’s $22.5 million.

Source: S&P Capital IQ. Quarterly periods. Dollar amounts in millions. Non-GAAP figures may vary to maintain comparability with estimates.

EPS details
Last quarter, non-GAAP EPS came in at -$0.15. GAAP EPS were -$0.12 for Q4 versus -$0.18 per share for the prior-year quarter.

Source: S&P Capital IQ. Quarterly periods. Non-GAAP figures may vary to maintain comparability with estimates.

Recent performance
For the preceding quarter, gross margin was 51.0%, 310 basis points better than the prior-year quarter. Operating margin was -27.9%, much better than the prior-year quarter. Net margin was -25.5%, much better than the prior-year quarter.

Looking ahead

The full year’s average estimate for revenue is $129.4 million. The average EPS estimate is -$0.54.

Investor sentiment
The stock has a one-star rating (out of five) at Motley Fool CAPS, with 79 members out of 176 rating the stock outperform, and 97 members rating it underperform. Among 61 CAPS All-Star picks (recommendations by the highest-ranked CAPS members), 23 give DexCom a green thumbs-up, and 38 give it a red thumbs-down.

Of Wall Street recommendations tracked by S&P Capital IQ, the average opinion on DexCom is outperform, with an average price target of $15.31.

Is DexCom the best health care stock for you? Learn how to maximize your investment income and “Secure Your Future With 9 Rock-Solid Dividend Stocks,” including one above-average health care logistics company. Click here for instant access to this free report.

The article Will DexCom Beat These Analyst Estimates? originally appeared on Fool.com.


Seth Jayson had no position in any company mentioned here at the time of publication. You can view his stock holdings here. He is co-advisor of
Motley Fool Hidden Gems, which provides new small-cap ideas every month, backed by a real-money portfolio. The Motley Fool has no position in any of the stocks mentioned. Try any of our Foolish newsletter services free for 30 days. We Fools may not all hold the same

Source: FULL ARTICLE at DailyFinance

Are You Expecting This from QuinStreet?

By Seth Jayson, The Motley Fool

Filed under:

QuinStreet (NAS: QNST) is expected to report Q3 earnings on April 30. Here’s what Wall Street wants to see:

The 10-second takeaway
Comparing the upcoming quarter to the prior-year quarter, average analyst estimates predict QuinStreet’s revenues will decrease -16.6% and EPS will shrink to a loss.

The average estimate for revenue is $77.5 million. On the bottom line, the average EPS estimate is -$0.02.

Revenue details
Last quarter, QuinStreet notched revenue of $71.8 million. GAAP reported sales were 21% lower than the prior-year quarter’s $90.5 million.

Source: S&P Capital IQ. Quarterly periods. Dollar amounts in millions. Non-GAAP figures may vary to maintain comparability with estimates.

EPS details
Last quarter, non-GAAP EPS came in at $0.01. GAAP EPS were -$1.48 for Q2 versus $0.09 per share for the prior-year quarter.

Source: S&P Capital IQ. Quarterly periods. Non-GAAP figures may vary to maintain comparability with estimates.

Recent performance
For the preceding quarter, gross margin was 14.0%, much worse than the prior-year quarter. Operating margin was -2.8%, much worse than the prior-year quarter. Net margin was -88.5%, much worse than the prior-year quarter.

Looking ahead

The full year’s average estimate for revenue is $305.8 million. The average EPS estimate is -$0.03.

Investor sentiment
The stock has a one-star rating (out of five) at Motley Fool CAPS, with 21 members out of 28 rating the stock outperform, and seven members rating it underperform. Among 11 CAPS All-Star picks (recommendations by the highest-ranked CAPS members), seven give QuinStreet a green thumbs-up, and four give it a red thumbs-down.

Of Wall Street recommendations tracked by S&P Capital IQ, the average opinion on QuinStreet is hold, with an average price target of $6.84.

Internet software and services are being consumed in radically different ways, on new and increasingly mobile devices. Is QuinStreet on the right side of the revolution? Check out the changing landscape and meet the company that Motley Fool analysts expect to lead “The Next Trillion-dollar Revolution.” Click here for instant access to this free report.

The article Are You Expecting This from QuinStreet? originally appeared on Fool.com.


Seth Jayson had no position in any company mentioned here at the time of publication. You can view his stock holdings here. He is co-advisor of
Motley Fool Hidden Gems, which provides new small-cap ideas every month, backed by a real-money portfolio. The Motley Fool has no position in any of the stocks mentioned. Try any of our Foolish newsletter services <a target=_blank

Source: FULL ARTICLE at DailyFinance

Can FEI Beat These Numbers?

By Seth Jayson, The Motley Fool

Filed under:

FEI (NAS: FEIC) is expected to report Q1 earnings on April 30. Here’s what Wall Street wants to see:

The 10-second takeaway
Comparing the upcoming quarter to the prior-year quarter, average analyst estimates predict FEI’s revenues will grow 1.8% and EPS will expand 3.2%.

The average estimate for revenue is $221.4 million. On the bottom line, the average EPS estimate is $0.65.

Revenue details
Last quarter, FEI recorded revenue of $230.9 million. GAAP reported sales were 8.4% higher than the prior-year quarter’s $213.0 million.

Source: S&P Capital IQ. Quarterly periods. Dollar amounts in millions. Non-GAAP figures may vary to maintain comparability with estimates.

EPS details
Last quarter, non-GAAP EPS came in at $0.77. GAAP EPS of $0.72 were the same as the prior-year quarter.

Source: S&P Capital IQ. Quarterly periods. Non-GAAP figures may vary to maintain comparability with estimates.

Recent performance
For the preceding quarter, gross margin was 47.2%, 280 basis points better than the prior-year quarter. Operating margin was 17.1%, 180 basis points better than the prior-year quarter. Net margin was 12.9%, 80 basis points worse than the prior-year quarter.

Looking ahead

The full year’s average estimate for revenue is $949.1 million. The average EPS estimate is $3.16.

Investor sentiment
The stock has a five-star rating (out of five) at Motley Fool CAPS, with 272 members out of 282 rating the stock outperform, and 10 members rating it underperform. Among 76 CAPS All-Star picks (recommendations by the highest-ranked CAPS members), 75 give FEI a green thumbs-up, and one give it a red thumbs-down.

Of Wall Street recommendations tracked by S&P Capital IQ, the average opinion on FEI is outperform, with an average price target of $59.56.

Looking for alternatives to FEI? It takes more than great companies to build a fortune for the future. Learn the basic financial habits of millionaires next door and get focused stock ideas in our free report, “3 Stocks That Will Help You Retire Rich.” Click here for instant access to this free report.

The article Can FEI Beat These Numbers? originally appeared on Fool.com.


Seth Jayson had no position in any company mentioned here at the time of publication. You can view his stock holdings here. He is co-advisor of
Motley Fool Hidden Gems, which provides new small-cap ideas every month, backed by a real-money portfolio. The Motley Fool recommends FEI. Try any of our Foolish newsletter services free for 30 days. We Fools may not all

Source: FULL ARTICLE at DailyFinance

Can STAAR Surgical Beat These Numbers?

By Seth Jayson, The Motley Fool

Filed under:

STAAR Surgical (NAS: STAA) is expected to report Q1 earnings on May 1. Here’s what Wall Street wants to see:

The 10-second takeaway
Comparing the upcoming quarter to the prior-year quarter, average analyst estimates predict STAAR Surgical’s revenues will increase 11.3% and EPS will shrink 0.0%.

The average estimate for revenue is $17.3 million. On the bottom line, the average EPS estimate is $0.04.

Revenue details
Last quarter, STAAR Surgical booked revenue of $16.5 million. GAAP reported sales were 0.5% higher than the prior-year quarter’s $16.4 million.

Source: S&P Capital IQ. Quarterly periods. Dollar amounts in millions. Non-GAAP figures may vary to maintain comparability with estimates.

EPS details
Last quarter, non-GAAP EPS came in at $0.01. GAAP EPS were -$0.04 for Q4 versus $0.00 per share for the prior-year quarter.

Source: S&P Capital IQ. Quarterly periods. Non-GAAP figures may vary to maintain comparability with estimates.

Recent performance
For the preceding quarter, gross margin was 67.8%, 200 basis points worse than the prior-year quarter. Operating margin was -3.6%, much worse than the prior-year quarter. Net margin was -8.6%, 930 basis points worse than the prior-year quarter.

Looking ahead

The full year’s average estimate for revenue is $70.6 million. The average EPS estimate is $0.16.

Investor sentiment
The stock has a two-star rating (out of five) at Motley Fool CAPS, with 77 members out of 86 rating the stock outperform, and nine members rating it underperform. Among 22 CAPS All-Star picks (recommendations by the highest-ranked CAPS members), 17 give STAAR Surgical a green thumbs-up, and five give it a red thumbs-down.

Of Wall Street recommendations tracked by S&P Capital IQ, the average opinion on STAAR Surgical is outperform, with an average price target of $9.00.

Is STAAR Surgical the best health care stock for you? Learn how to maximize your investment income and “Secure Your Future With 9 Rock-Solid Dividend Stocks,” including one above-average health care logistics company. Click here for instant access to this free report.

The article Can STAAR Surgical Beat These Numbers? originally appeared on Fool.com.


Seth Jayson had no position in any company mentioned here at the time of publication. You can view his stock holdings here. He is co-advisor of
Motley Fool Hidden Gems, which provides new small-cap ideas every month, backed by a real-money portfolio. The Motley Fool has no position in any of the stocks mentioned. Try any of our Foolish newsletter services free for 30 days. We

Source: FULL ARTICLE at DailyFinance

What Does Wall Street See for Sourcefire's Q1?

By Seth Jayson, The Motley Fool

Filed under:

Sourcefire (NAS: FIRE) is expected to report Q1 earnings on April 30. Here’s what Wall Street wants to see:

The 10-second takeaway
Comparing the upcoming quarter to the prior-year quarter, average analyst estimates predict Sourcefire’s revenues will grow 23.9% and EPS will increase 9.1%.

The average estimate for revenue is $57.4 million. On the bottom line, the average EPS estimate is $0.12.

Revenue details
Last quarter, Sourcefire booked revenue of $67.4 million. GAAP reported sales were 27% higher than the prior-year quarter’s $53.2 million.

Source: S&P Capital IQ. Quarterly periods. Dollar amounts in millions. Non-GAAP figures may vary to maintain comparability with estimates.

EPS details
Last quarter, non-GAAP EPS came in at $0.29. GAAP EPS of $0.08 for Q4 were 43% lower than the prior-year quarter’s $0.14 per share.

Source: S&P Capital IQ. Quarterly periods. Non-GAAP figures may vary to maintain comparability with estimates.

Recent performance
For the preceding quarter, gross margin was 76.0%, 90 basis points worse than the prior-year quarter. Operating margin was 7.0%, much worse than the prior-year quarter. Net margin was 3.9%, 390 basis points worse than the prior-year quarter.

Looking ahead

The full year’s average estimate for revenue is $279.2 million. The average EPS estimate is $0.98.

Investor sentiment
The stock has a two-star rating (out of five) at Motley Fool CAPS, with 144 members out of 180 rating the stock outperform, and 36 members rating it underperform. Among 42 CAPS All-Star picks (recommendations by the highest-ranked CAPS members), 35 give Sourcefire a green thumbs-up, and seven give it a red thumbs-down.

Of Wall Street recommendations tracked by S&P Capital IQ, the average opinion on Sourcefire is outperform, with an average price target of $57.00.

Software and computerized services are being consumed in radically different ways, on new and increasingly mobile devices. Many old leaders will be left behind. Whether or not Sourcefire makes the coming cut, you should check out the company that Motley Fool analysts expect to lead the pack in “The Next Trillion-dollar Revolution.” Click here for instant access to this free report.

The article What Does Wall Street See for Sourcefire’s Q1? originally appeared on Fool.com.


Seth Jayson had no position in any company mentioned here at the time of publication. You can view his stock holdings here. He is co-advisor of
Motley Fool Hidden Gems, which provides new small-cap ideas every month, backed by a real-money portfolio. The Motley Fool recommends Sourcefire. Try any of

Source: FULL ARTICLE at DailyFinance

Will General Communication Beat These Analyst Estimates?

By Seth Jayson, The Motley Fool

Filed under:

General Communication (NAS: GNCMA) is expected to report Q1 earnings on May 1. Here’s what Wall Street wants to see:

The 10-second takeaway
Comparing the upcoming quarter to the prior-year quarter, average analyst estimates predict General Communication‘s revenues will grow 5.0% and EPS will increase 100.0%.

The average estimate for revenue is $180.4 million. On the bottom line, the average EPS estimate is $0.06.

Revenue details
Last quarter, General Communication chalked up revenue of $183.7 million. GAAP reported sales were 8.8% higher than the prior-year quarter’s $168.8 million.

Source: S&P Capital IQ. Quarterly periods. Dollar amounts in millions. Non-GAAP figures may vary to maintain comparability with estimates.

EPS details
Last quarter, EPS came in at $0.01. GAAP EPS were $0.01 for Q4 versus -$0.02 per share for the prior-year quarter.

Source: S&P Capital IQ. Quarterly periods. Non-GAAP figures may vary to maintain comparability with estimates.

Recent performance
For the preceding quarter, gross margin was 62.0%, 500 basis points worse than the prior-year quarter. Operating margin was 10.5%, 100 basis points better than the prior-year quarter. Net margin was 0.3%, 80 basis points better than the prior-year quarter.

Looking ahead

The full year’s average estimate for revenue is $765.4 million. The average EPS estimate is $0.36.

Investor sentiment

Of Wall Street recommendations tracked by S&P Capital IQ, the average opinion on General Communication is buy, with an average price target of $12.67.

Looking for alternatives to General Communication? It takes more than great companies to build a fortune for the future. Learn the basic financial habits of millionaires next door and get focused stock ideas in our free report, “3 Stocks That Will Help You Retire Rich.” Click here for instant access to this free report.

The article Will General Communication Beat These Analyst Estimates? originally appeared on Fool.com.


Seth Jayson had no position in any company mentioned here at the time of publication. You can view his stock holdings here. He is co-advisor of
Motley Fool Hidden Gems, which provides new small-cap ideas every month, backed by a real-money portfolio. The Motley Fool has no position in any of the stocks mentioned. Try any of our Foolish newsletter services free for 30 days. We Fools may not all hold the same opinions, but we all believe that considering a diverse range of insights makes us better investors. The Motley Fool has a disclosure policy.

Copyright © 1995 – 2013 The Motley Fool, LLC.

Source: FULL ARTICLE at DailyFinance

Will These Numbers from Integra LifeSciences Holdings Be Good Enough for You?

By Seth Jayson, The Motley Fool

Filed under:

Integra LifeSciences Holdings (NAS: IART) is expected to report Q1 earnings on May 2. Here’s what Wall Street wants to see:

The 10-second takeaway
Comparing the upcoming quarter to the prior-year quarter, average analyst estimates predict Integra LifeSciences Holdings’s revenues will wane -0.5% and EPS will contract -49.3%.

The average estimate for revenue is $195.1 million. On the bottom line, the average EPS estimate is $0.36.

Revenue details
Last quarter, Integra LifeSciences Holdings reported revenue of $214.4 million. GAAP reported sales were 5.4% higher than the prior-year quarter’s $203.5 million.

Source: S&P Capital IQ. Quarterly periods. Dollar amounts in millions. Non-GAAP figures may vary to maintain comparability with estimates.

EPS details
Last quarter, non-GAAP EPS came in at $0.78. GAAP EPS of $0.45 for Q4 were 181% higher than the prior-year quarter’s $0.16 per share.

Source: S&P Capital IQ. Quarterly periods. Non-GAAP figures may vary to maintain comparability with estimates.

Recent performance
For the preceding quarter, gross margin was 64.3%, 20 basis points worse than the prior-year quarter. Operating margin was 14.0%, 140 basis points worse than the prior-year quarter. Net margin was 6.0%, 380 basis points better than the prior-year quarter.

Looking ahead

The full year’s average estimate for revenue is $847.9 million. The average EPS estimate is $2.57.

Investor sentiment
The stock has a three-star rating (out of five) at Motley Fool CAPS, with 153 members out of 163 rating the stock outperform, and 10 members rating it underperform. Among 52 CAPS All-Star picks (recommendations by the highest-ranked CAPS members), 49 give Integra LifeSciences Holdings a green thumbs-up, and three give it a red thumbs-down.

Of Wall Street recommendations tracked by S&P Capital IQ, the average opinion on Integra LifeSciences Holdings is outperform, with an average price target of $43.08.

Is Integra LifeSciences Holdings the best health care stock for you? Learn how to maximize your investment income and “Secure Your Future With 9 Rock-Solid Dividend Stocks,” including one above-average health care logistics company. Click here for instant access to this free report.

The article Will These Numbers from Integra LifeSciences Holdings Be Good Enough for You? originally appeared on Fool.com.


Seth Jayson had no position in any company mentioned here at the time of publication. You can view his stock holdings here. He is co-advisor of
Motley Fool Hidden Gems, which provides new small-cap ideas every month, backed by a real-money portfolio. The Motley Fool has no position in any

Source: FULL ARTICLE at DailyFinance

Will These Numbers from Plains Exploration &amp; Production Be Good Enough for You?

By Seth Jayson, The Motley Fool

Filed under:

Plains Exploration & Production (NYS: PXP) is expected to report Q1 earnings on May 2. Here’s what Wall Street wants to see:

The 10-second takeaway
Comparing the upcoming quarter to the prior-year quarter, average analyst estimates predict Plains Exploration & Production’s revenues will expand 125.4% and EPS will grow 50.0%.

The average estimate for revenue is $1.18 billion. On the bottom line, the average EPS estimate is $0.87.

Revenue details
Last quarter, Plains Exploration & Production reported revenue of $869.2 million. GAAP reported sales were 68% higher than the prior-year quarter’s $517.5 million.

Source: S&P Capital IQ. Quarterly periods. Dollar amounts in millions. Non-GAAP figures may vary to maintain comparability with estimates.

EPS details
Last quarter, non-GAAP EPS came in at $0.41. GAAP EPS of $1.65 for Q4 were 139% higher than the prior-year quarter’s $0.69 per share.

Source: S&P Capital IQ. Quarterly periods. Non-GAAP figures may vary to maintain comparability with estimates.

Recent performance
For the preceding quarter, gross margin was 78.0%, 910 basis points better than the prior-year quarter. Operating margin was 22.7%, 520 basis points better than the prior-year quarter. Net margin was 25.2%, 630 basis points better than the prior-year quarter.

Looking ahead

The full year’s average estimate for revenue is $4.58 billion. The average EPS estimate is $3.47.

Investor sentiment
The stock has a three-star rating (out of five) at Motley Fool CAPS, with 381 members out of 397 rating the stock outperform, and 16 members rating it underperform. Among 75 CAPS All-Star picks (recommendations by the highest-ranked CAPS members), 71 give Plains Exploration & Production a green thumbs-up, and four give it a red thumbs-down.

Of Wall Street recommendations tracked by S&P Capital IQ, the average opinion on Plains Exploration & Production is hold, with an average price target of $47.05.

Is Plains Exploration & Production the right energy stock for you? Read about a handful of timely, profit-producing plays on expensive crude in “3 Stocks for $100 Oil.” Click here for instant access to this free report.

The article Will These Numbers from Plains Exploration & Production Be Good Enough for You? originally appeared on Fool.com.


Seth Jayson had no position in any company mentioned here at the time of publication. You can view his stock holdings here. He is co-advisor of
Motley Fool Hidden Gems, which provides new small-cap ideas every month, backed by a real-money portfolio. The Motley Fool has no position in

Source: FULL ARTICLE at DailyFinance

Does The Street Have Cbeyond Figured Out?

By Seth Jayson, The Motley Fool

Filed under:

Cbeyond (NAS: CBEY) is expected to report Q1 earnings on May 1. Here’s what Wall Street wants to see:

The 10-second takeaway
Comparing the upcoming quarter to the prior-year quarter, average analyst estimates predict Cbeyond’s revenues will drop -5.0% and EPS will shrink to a loss.

The average estimate for revenue is $117.6 million. On the bottom line, the average EPS estimate is -$0.09.

Revenue details
Last quarter, Cbeyond booked revenue of $118.9 million. GAAP reported sales were 3.6% lower than the prior-year quarter’s $123.3 million.

Source: S&P Capital IQ. Quarterly periods. Dollar amounts in millions. Non-GAAP figures may vary to maintain comparability with estimates.

EPS details
Last quarter, non-GAAP EPS came in at -$0.18. GAAP EPS were -$0.20 for Q4 versus -$0.18 per share for the prior-year quarter.

Source: S&P Capital IQ. Quarterly periods. Non-GAAP figures may vary to maintain comparability with estimates.

Recent performance
For the preceding quarter, gross margin was 69.2%, 30 basis points worse than the prior-year quarter. Operating margin was -0.5%, 310 basis points worse than the prior-year quarter. Net margin was -4.9%, 80 basis points worse than the prior-year quarter.

Looking ahead

The full year’s average estimate for revenue is $476.1 million. The average EPS estimate is -$0.30.

Investor sentiment
The stock has a one-star rating (out of five) at Motley Fool CAPS, with 105 members out of 141 rating the stock outperform, and 36 members rating it underperform. Among 42 CAPS All-Star picks (recommendations by the highest-ranked CAPS members), 27 give Cbeyond a green thumbs-up, and 15 give it a red thumbs-down.

Of Wall Street recommendations tracked by S&P Capital IQ, the average opinion on Cbeyond is hold, with an average price target of $8.57.

Looking for alternatives to Cbeyond? It takes more than great companies to build a fortune for the future. Learn the basic financial habits of millionaires next door and get focused stock ideas in our free report, “3 Stocks That Will Help You Retire Rich.” Click here for instant access to this free report.

The article Does The Street Have Cbeyond Figured Out? originally appeared on Fool.com.


Seth Jayson had no position in any company mentioned here at the time of publication. You can view his stock holdings here. He is co-advisor of
Motley Fool Hidden Gems, which provides new small-cap ideas every month, backed by a real-money portfolio. The Motley Fool has no position in any of the stocks mentioned. Try any of

Source: FULL ARTICLE at DailyFinance

Can Mylan Beat These Numbers?

By Seth Jayson, The Motley Fool

Filed under:

Mylan (NAS: MYL) is expected to report Q1 earnings on May 2. Here’s what Wall Street wants to see:

The 10-second takeaway
Comparing the upcoming quarter to the prior-year quarter, average analyst estimates predict Mylan’s revenues will expand 6.4% and EPS will expand 19.2%.

The average estimate for revenue is $1.69 billion. On the bottom line, the average EPS estimate is $0.62.

Revenue details
Last quarter, Mylan reported revenue of $1.72 billion. GAAP reported sales were 11% higher than the prior-year quarter’s $1.53 billion.

Source: S&P Capital IQ. Quarterly periods. Dollar amounts in millions. Non-GAAP figures may vary to maintain comparability with estimates.

EPS details
Last quarter, non-GAAP EPS came in at $0.65. GAAP EPS of $0.39 for Q4 were 30% higher than the prior-year quarter’s $0.30 per share.

Source: S&P Capital IQ. Quarterly periods. Non-GAAP figures may vary to maintain comparability with estimates.

Recent performance
For the preceding quarter, gross margin was 46.1%, 290 basis points better than the prior-year quarter. Operating margin was 20.9%, 180 basis points better than the prior-year quarter. Net margin was 9.5%, 100 basis points better than the prior-year quarter.

Looking ahead

The full year’s average estimate for revenue is $7.17 billion. The average EPS estimate is $2.87.

Investor sentiment
The stock has a four-star rating (out of five) at Motley Fool CAPS, with 534 members out of 569 rating the stock outperform, and 35 members rating it underperform. Among 171 CAPS All-Star picks (recommendations by the highest-ranked CAPS members), 163 give Mylan a green thumbs-up, and eight give it a red thumbs-down.

Of Wall Street recommendations tracked by S&P Capital IQ, the average opinion on Mylan is outperform, with an average price target of $28.67.

The article Can Mylan Beat These Numbers? originally appeared on Fool.com.


Seth Jayson had no position in any company mentioned here at the time of publication. You can view his stock holdings here. He is co-advisor of
Motley Fool Hidden Gems, which provides new small-cap ideas every month, backed by a real-money portfolio. The Motley Fool has no position in any of the stocks mentioned. Try any of our Foolish newsletter services free for 30 days. We Fools may not all hold the same opinions, but we all believe that considering a diverse range of insights makes us better investors. The Motley Fool has a disclosure policy.

Copyright © 1995 – 2013 The Motley Fool, LLC. All rights reserved. The

Source: FULL ARTICLE at DailyFinance

It's Showtime for Mercer International

By Seth Jayson, The Motley Fool

Filed under:

Mercer International (NAS: MERC) is expected to report Q1 earnings on May 2. Here’s what Wall Street wants to see:

The 10-second takeaway
Comparing the upcoming quarter to the prior-year quarter, average analyst estimates predict Mercer International‘s revenues will drop -6.4% and EPS will compress 0.0%.

The average estimate for revenue is $268.8 million. On the bottom line, the average EPS estimate is $0.01.

Revenue details
Last quarter, Mercer International recorded revenue of $248.5 million. GAAP reported sales were 17% lower than the prior-year quarter’s $300.9 million.

Source: S&P Capital IQ. Quarterly periods. Dollar amounts in millions. Non-GAAP figures may vary to maintain comparability with estimates.

EPS details
Last quarter, non-GAAP EPS came in at -$0.18. GAAP EPS were -$0.12 for Q4 against -$0.04 per share for the prior-year quarter.

Source: S&P Capital IQ. Quarterly periods. Non-GAAP figures may vary to maintain comparability with estimates.

Recent performance
For the preceding quarter, gross margin was 16.4%, 420 basis points better than the prior-year quarter. Operating margin was 3.8%, 250 basis points better than the prior-year quarter. Net margin was -2.7%, 190 basis points worse than the prior-year quarter.

Looking ahead

The full year’s average estimate for revenue is $1.12 billion. The average EPS estimate is $0.54.

Investor sentiment
The stock has a four-star rating (out of five) at Motley Fool CAPS, with 150 members out of 164 rating the stock outperform, and 14 members rating it underperform. Among 33 CAPS All-Star picks (recommendations by the highest-ranked CAPS members), 32 give Mercer International a green thumbs-up, and one give it a red thumbs-down.

Of Wall Street recommendations tracked by S&P Capital IQ, the average opinion on Mercer International is hold, with an average price target of $8.00.

The rich are different than you and me: They might not notice the moneymaking stories right under our noses. In our new report, “Middle-Class Millionaire-Makers: 3 Stocks Wall Street‘s Too Rich to Notice,” we give you three Peter Lynch-inspired buy-what-you-know stocks for the 99%. Click here for instant access to this free report.

The article It’s Showtime for Mercer International originally appeared on Fool.com.


Seth Jayson had no position in any company mentioned here at the time of publication. You can view his stock holdings here. He is co-advisor of
Motley Fool Hidden Gems, which provides new small-cap ideas every month, backed by a real-money portfolio. The Motley Fool has no position in any of the stocks mentioned. Try

Source: FULL ARTICLE at DailyFinance

It's Showtime for ONEOK

By Seth Jayson, The Motley Fool

Filed under:

ONEOK (NYS: OKE) is expected to report Q1 earnings on April 30. Here’s what Wall Street wants to see:

The 10-second takeaway
Comparing the upcoming quarter to the prior-year quarter, average analyst estimates predict ONEOK‘s revenues will grow 9.7% and EPS will grow 9.1%.

The average estimate for revenue is $3.75 billion. On the bottom line, the average EPS estimate is $0.60.

Revenue details
Last quarter, ONEOK logged revenue of $3.66 billion. GAAP reported sales were 10% lower than the prior-year quarter’s $4.07 billion.

Source: S&P Capital IQ. Quarterly periods. Dollar amounts in millions. Non-GAAP figures may vary to maintain comparability with estimates.

EPS details
Last quarter, EPS came in at $0.53. GAAP EPS of $0.53 for Q4 were 3.6% lower than the prior-year quarter’s $0.55 per share.

Source: S&P Capital IQ. Quarterly periods. Non-GAAP figures may vary to maintain comparability with estimates.

Recent performance
For the preceding quarter, gross margin was 11.0%, 30 basis points worse than the prior-year quarter. Operating margin was 8.0%, 100 basis points worse than the prior-year quarter. Net margin was 3.0%, 20 basis points better than the prior-year quarter.

Looking ahead

The full year’s average estimate for revenue is $14.82 billion. The average EPS estimate is $1.81.

Investor sentiment
The stock has a four-star rating (out of five) at Motley Fool CAPS, with 420 members out of 436 rating the stock outperform, and 16 members rating it underperform. Among 153 CAPS All-Star picks (recommendations by the highest-ranked CAPS members), 148 give ONEOK a green thumbs-up, and five give it a red thumbs-down.

Of Wall Street recommendations tracked by S&P Capital IQ, the average opinion on ONEOK is outperform, with an average price target of $53.10.

Can your portfolio provide you with enough income to last through retirement? You’ll need more than ONEOK. Learn how to maximize your investment income and “Secure Your Future With 9 Rock-Solid Dividend Stocks.” Click here for instant access to this free report.

The article It’s Showtime for ONEOK originally appeared on Fool.com.


Seth Jayson had no position in any company mentioned here at the time of publication. You can view his stock holdings here. He is co-advisor of
Motley Fool Hidden Gems, which provides new small-cap ideas every month, backed by a real-money portfolio. The Motley Fool recommends ONEOK. Try any of our Foolish newsletter services free for 30 days. We Fools may not all hold the same opinions, but we all believe

Source: FULL ARTICLE at DailyFinance

What to Expect from Merge Healthcare

By Seth Jayson, The Motley Fool

Filed under:

Merge Healthcare (NAS: MRGE) is expected to report Q1 earnings on May 1. Here’s what Wall Street wants to see:

The 10-second takeaway
Comparing the upcoming quarter to the prior-year quarter, average analyst estimates predict Merge Healthcare‘s revenues will grow 4.5% and EPS will increase 33.3%.

The average estimate for revenue is $63.7 million. On the bottom line, the average EPS estimate is $0.04.

Revenue details
Last quarter, Merge Healthcare chalked up revenue of $64.6 million. GAAP reported sales were 0.9% higher than the prior-year quarter’s $64.1 million.

Source: S&P Capital IQ. Quarterly periods. Dollar amounts in millions. Non-GAAP figures may vary to maintain comparability with estimates.

EPS details
Last quarter, non-GAAP EPS came in at -$0.13. GAAP EPS were -$0.19 for Q4 compared to -$0.01 per share for the prior-year quarter.

Source: S&P Capital IQ. Quarterly periods. Non-GAAP figures may vary to maintain comparability with estimates.

Recent performance
For the preceding quarter, gross margin was 57.3%, 900 basis points worse than the prior-year quarter. Operating margin was -9.6%, much worse than the prior-year quarter. Net margin was -26.7%, much worse than the prior-year quarter.

Looking ahead

The full year’s average estimate for revenue is $265.4 million. The average EPS estimate is $0.17.

Investor sentiment
The stock has a three-star rating (out of five) at Motley Fool CAPS, with 111 members out of 132 rating the stock outperform, and 21 members rating it underperform. Among 36 CAPS All-Star picks (recommendations by the highest-ranked CAPS members), 32 give Merge Healthcare a green thumbs-up, and four give it a red thumbs-down.

Of Wall Street recommendations tracked by S&P Capital IQ, the average opinion on Merge Healthcare is outperform, with an average price target of $3.88.

Is Merge Healthcare the best health care stock for you? Learn how to maximize your investment income and “Secure Your Future With 9 Rock-Solid Dividend Stocks,” including one above-average health care logistics company. Click here for instant access to this free report.

The article What to Expect from Merge Healthcare originally appeared on Fool.com.


Seth Jayson had no position in any company mentioned here at the time of publication. You can view his stock holdings here. He is co-advisor of
Motley Fool Hidden Gems, which provides new small-cap ideas every month, backed by a real-money portfolio. The Motley Fool has no position in any of the stocks mentioned. Try any of our Foolish newsletter services free for 30 days. We

Source: FULL ARTICLE at DailyFinance

Are You Expecting This from Liquidity Services?

By Seth Jayson, The Motley Fool

Filed under:

Liquidity Services (NAS: LQDT) is expected to report Q2 earnings on May 2. Here’s what Wall Street wants to see:

The 10-second takeaway
Comparing the upcoming quarter to the prior-year quarter, average analyst estimates predict Liquidity Services‘s revenues will grow 12.1% and EPS will wane -2.0%.

The average estimate for revenue is $140.9 million. On the bottom line, the average EPS estimate is $0.48.

Revenue details
Last quarter, Liquidity Services booked revenue of $122.2 million. GAAP reported sales were 15% higher than the prior-year quarter’s $106.0 million.

Source: S&P Capital IQ. Quarterly periods. Dollar amounts in millions. Non-GAAP figures may vary to maintain comparability with estimates.

EPS details
Last quarter, non-GAAP EPS came in at $0.41. GAAP EPS of $0.20 for Q1 were 29% lower than the prior-year quarter’s $0.28 per share.

Source: S&P Capital IQ. Quarterly periods. Non-GAAP figures may vary to maintain comparability with estimates.

Recent performance
For the preceding quarter, gross margin was 43.0%, 130 basis points worse than the prior-year quarter. Operating margin was 12.8%, 280 basis points worse than the prior-year quarter. Net margin was 5.5%, 310 basis points worse than the prior-year quarter.

Looking ahead

The full year’s average estimate for revenue is $544.2 million. The average EPS estimate is $1.97.

Investor sentiment
The stock has a five-star rating (out of five) at Motley Fool CAPS, with 523 members out of 548 rating the stock outperform, and 25 members rating it underperform. Among 151 CAPS All-Star picks (recommendations by the highest-ranked CAPS members), 147 give Liquidity Services a green thumbs-up, and four give it a red thumbs-down.

Of Wall Street recommendations tracked by S&P Capital IQ, the average opinion on Liquidity Services is buy, with an average price target of $57.85.

Internet software and services are being consumed in radically different ways, on new and increasingly mobile devices. Is Liquidity Services on the right side of the revolution? Check out the changing landscape and meet the company that Motley Fool analysts expect to lead “The Next Trillion-dollar Revolution.” Click here for instant access to this free report.

The article Are You Expecting This from Liquidity Services? originally appeared on Fool.com.


Seth Jayson had no position in any company mentioned here at the time of publication. You can view his stock holdings here. He is co-advisor of
Motley Fool Hidden Gems, which provides new small-cap ideas every month, backed by a real-money portfolio. The Motley Fool recommends Liquidity Services.

Source: FULL ARTICLE at DailyFinance