Tag Archives: Middle Class Millionaire Makers

It's Showtime for Mercer International

By Seth Jayson, The Motley Fool

Filed under:

Mercer International (NAS: MERC) is expected to report Q1 earnings on May 2. Here’s what Wall Street wants to see:

The 10-second takeaway
Comparing the upcoming quarter to the prior-year quarter, average analyst estimates predict Mercer International‘s revenues will drop -6.4% and EPS will compress 0.0%.

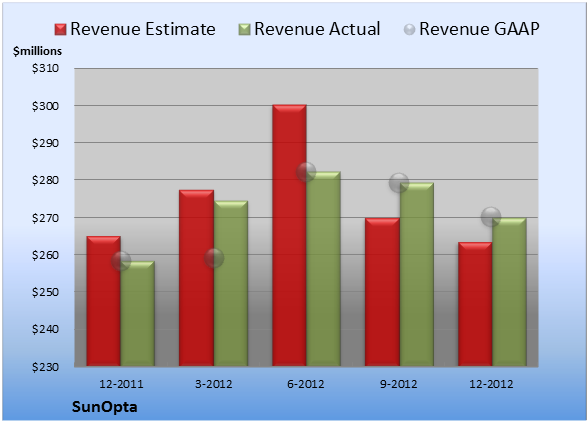
The average estimate for revenue is $268.8 million. On the bottom line, the average EPS estimate is $0.01.

Revenue details
Last quarter, Mercer International recorded revenue of $248.5 million. GAAP reported sales were 17% lower than the prior-year quarter’s $300.9 million.

Source: S&P Capital IQ. Quarterly periods. Dollar amounts in millions. Non-GAAP figures may vary to maintain comparability with estimates.

EPS details
Last quarter, non-GAAP EPS came in at -$0.18. GAAP EPS were -$0.12 for Q4 against -$0.04 per share for the prior-year quarter.

Source: S&P Capital IQ. Quarterly periods. Non-GAAP figures may vary to maintain comparability with estimates.

Recent performance
For the preceding quarter, gross margin was 16.4%, 420 basis points better than the prior-year quarter. Operating margin was 3.8%, 250 basis points better than the prior-year quarter. Net margin was -2.7%, 190 basis points worse than the prior-year quarter.

Looking ahead

The full year’s average estimate for revenue is $1.12 billion. The average EPS estimate is $0.54.

Investor sentiment
The stock has a four-star rating (out of five) at Motley Fool CAPS, with 150 members out of 164 rating the stock outperform, and 14 members rating it underperform. Among 33 CAPS All-Star picks (recommendations by the highest-ranked CAPS members), 32 give Mercer International a green thumbs-up, and one give it a red thumbs-down.

Of Wall Street recommendations tracked by S&P Capital IQ, the average opinion on Mercer International is hold, with an average price target of $8.00.

The rich are different than you and me: They might not notice the moneymaking stories right under our noses. In our new report, “Middle-Class Millionaire-Makers: 3 Stocks Wall Street‘s Too Rich to Notice,” we give you three Peter Lynch-inspired buy-what-you-know stocks for the 99%. Click here for instant access to this free report.

The article It’s Showtime for Mercer International originally appeared on Fool.com.


Seth Jayson had no position in any company mentioned here at the time of publication. You can view his stock holdings here. He is co-advisor of
Motley Fool Hidden Gems, which provides new small-cap ideas every month, backed by a real-money portfolio. The Motley Fool has no position in any of the stocks mentioned. Try

Source: FULL ARTICLE at DailyFinance

Does The Street Have Zoltek Companies Figured Out?

By Seth Jayson, The Motley Fool

Filed under:

Zoltek Companies (NAS: ZOLT) is expected to report Q2 earnings around May 1. Here’s what Wall Street wants to see:

The 10-second takeaway
Comparing the upcoming quarter to the prior-year quarter, average analyst estimates predict Zoltek Companies‘s revenues will wane -20.2% and EPS will contract 0.0%.

The average estimate for revenue is $37.5 million. On the bottom line, the average EPS estimate is $0.10.

Revenue details
Last quarter, Zoltek Companies reported revenue of $35.9 million. GAAP reported sales were 24% lower than the prior-year quarter’s $47.0 million.

Source: S&P Capital IQ. Quarterly periods. Dollar amounts in millions. Non-GAAP figures may vary to maintain comparability with estimates.

EPS details
Last quarter, EPS came in at $0.09. GAAP EPS of $0.09 for Q1 were 68% lower than the prior-year quarter’s $0.28 per share.

Source: S&P Capital IQ. Quarterly periods. Non-GAAP figures may vary to maintain comparability with estimates.

Recent performance
For the preceding quarter, gross margin was 25.3%, 270 basis points worse than the prior-year quarter. Operating margin was 10.2%, 720 basis points worse than the prior-year quarter. Net margin was 8.3%, much worse than the prior-year quarter.

Looking ahead

The full year’s average estimate for revenue is $156.4 million. The average EPS estimate is $0.44.

Investor sentiment
The stock has a four-star rating (out of five) at Motley Fool CAPS, with 721 members out of 765 rating the stock outperform, and 44 members rating it underperform. Among 140 CAPS All-Star picks (recommendations by the highest-ranked CAPS members), 127 give Zoltek Companies a green thumbs-up, and 13 give it a red thumbs-down.

Of Wall Street recommendations tracked by S&P Capital IQ, the average opinion on Zoltek Companies is hold, with an average price target of $8.50.

The rich are different than you and me: They might not notice the moneymaking stories right under our noses. In our new report, “Middle-Class Millionaire-Makers: 3 Stocks Wall Street‘s Too Rich to Notice,” we give you three Peter Lynch-inspired buy-what-you-know stocks for the 99%. Click here for instant access to this free report.

The article Does The Street Have Zoltek Companies Figured Out? originally appeared on Fool.com.


Seth Jayson had no position in any company mentioned here at the time of publication. You can view his stock holdings here. He is co-advisor of
Motley Fool Hidden Gems, which provides new small-cap ideas every month, backed by a real-money portfolio. The Motley Fool has no position in any of the stocks

Source: FULL ARTICLE at DailyFinance

It's Showtime for ZAGG

By Seth Jayson, The Motley Fool

Filed under:

ZAGG (NAS: ZAGG) is expected to report Q1 earnings on May 2. Here’s what Wall Street wants to see:

The 10-second takeaway
Comparing the upcoming quarter to the prior-year quarter, average analyst estimates predict ZAGG‘s revenues will grow 19.9% and EPS will expand 56.3%.

The average estimate for revenue is $66.5 million. On the bottom line, the average EPS estimate is $0.25.

Revenue details
Last quarter, ZAGG reported revenue of $87.5 million. GAAP reported sales were 29% higher than the prior-year quarter’s $67.6 million.

Source: S&P Capital IQ. Quarterly periods. Dollar amounts in millions. Non-GAAP figures may vary to maintain comparability with estimates.

EPS details
Last quarter, non-GAAP EPS came in at $0.35. GAAP EPS of $0.01 for Q4 were 97% lower than the prior-year quarter’s $0.32 per share.

Source: S&P Capital IQ. Quarterly periods. Non-GAAP figures may vary to maintain comparability with estimates.

Recent performance
For the preceding quarter, gross margin was 44.1%, 900 basis points worse than the prior-year quarter. Operating margin was 19.2%, 940 basis points worse than the prior-year quarter. Net margin was 0.2%, much worse than the prior-year quarter.

Looking ahead

The full year’s average estimate for revenue is $315.8 million. The average EPS estimate is $1.17.

Investor sentiment
The stock has a one-star rating (out of five) at Motley Fool CAPS, with 279 members out of 364 rating the stock outperform, and 85 members rating it underperform. Among 76 CAPS All-Star picks (recommendations by the highest-ranked CAPS members), 36 give ZAGG a green thumbs-up, and 40 give it a red thumbs-down.

Of Wall Street recommendations tracked by S&P Capital IQ, the average opinion on ZAGG is outperform, with an average price target of $13.68.

The rich are different than you and me: They might not notice the moneymaking stories right under our noses. In our new report, “Middle-Class Millionaire-Makers: 3 Stocks Wall Street‘s Too Rich to Notice,” we give you three Peter Lynch-inspired buy-what-you-know stocks for the 99%. Click here for instant access to this free report.

The article It’s Showtime for ZAGG originally appeared on Fool.com.


Seth Jayson had no position in any company mentioned here at the time of publication. You can view his stock holdings here. He is co-advisor of
Motley Fool Hidden Gems, which provides new small-cap ideas every month, backed by a real-money portfolio. The Motley Fool has no position in any of the stocks mentioned. Try any of our Foolish newsletter services <a target=_blank

Source: FULL ARTICLE at DailyFinance

CarMax Beats on Revenue, Matches Expectations on EPS

By Seth Jayson, The Motley Fool

Filed under:

CarMax (NYS: KMX) reported earnings on April 10. Here are the numbers you need to know.

The 10-second takeaway
For the quarter ended Feb. 28 (Q4), CarMax beat expectations on revenues and met expectations on earnings per share.

Compared to the prior-year quarter, revenue grew. GAAP earnings per share grew.

Gross margins shrank, operating margins shrank, net margins were steady.

Revenue details
CarMax reported revenue of $2.83 billion. The 12 analysts polled by S&P Capital IQ predicted a top line of $2.73 billion on the same basis. GAAP reported sales were 14% higher than the prior-year quarter’s $2.54 billion.

Source: S&P Capital IQ. Quarterly periods. Dollar amounts in millions. Non-GAAP figures may vary to maintain comparability with estimates.

EPS details
EPS came in at $0.46. The 15 earnings estimates compiled by S&P Capital IQ averaged $0.46 per share. GAAP EPS of $0.46 for Q4 were 15% higher than the prior-year quarter’s $0.40 per share.

Source: S&P Capital IQ. Quarterly periods. Non-GAAP figures may vary to maintain comparability with estimates.

Margin details
For the quarter, gross margin was 15.3%, 60 basis points worse than the prior-year quarter. Operating margin was 6.2%, 90 basis points worse than the prior-year quarter. Net margin was 3.7%, much about the same as the prior-year quarter. (Margins calculated in GAAP terms.)

Looking ahead
Next quarter’s average estimate for revenue is $3.11 billion. On the bottom line, the average EPS estimate is $0.57.

Next year’s average estimate for revenue is $12.16 billion. The average EPS estimate is $2.09.

Investor sentiment

Of Wall Street recommendations tracked by S&P Capital IQ, the average opinion on CarMax is outperform, with an average price target of $40.00.

The rich are different than you and me: They might not notice the moneymaking stories right under our noses. In our new report, “Middle-Class Millionaire-Makers: 3 Stocks Wall Street’s Too Rich to Notice,” we give you three Peter Lynch-inspired buy-what-you-know stocks for the 99%. Click here for instant access to this free report.

The article CarMax Beats on Revenue, Matches Expectations on EPS originally appeared on Fool.com.


Seth Jayson had no position in any company mentioned here at the time of publication. You can view his stock holdings here. He is co-advisor of
Motley Fool Hidden Gems, which provides new small-cap ideas every month, backed by a real-money portfolio. The Motley Fool has no position in any of the stocks mentioned. Try any of our Foolish

From: http://www.dailyfinance.com/2013/04/11/carmax-beats-on-revenue-matches-expectations-on-e/

McCormick Beats on Revenue, Matches Expectations on EPS

By Seth Jayson, The Motley Fool

Hennessey Venom GT

Filed under:

McCormick (NYS: MKC) reported earnings on April 2. Here are the numbers you need to know.

The 10-second takeaway
For the quarter ended Feb. 28 (Q1), McCormick beat slightly on revenues and met expectations on earnings per share.

Compared to the prior-year quarter, revenue grew. GAAP earnings per share expanded.

Margins dropped across the board.

Revenue details
McCormick logged revenue of $934.4 million. The 10 analysts polled by S&P Capital IQ wanted to see revenue of $922.8 million on the same basis. GAAP reported sales were the same as the prior-year quarter’s.

Source: S&P Capital IQ. Quarterly periods. Dollar amounts in millions. Non-GAAP figures may vary to maintain comparability with estimates.

EPS details
EPS came in at $0.57. The 14 earnings estimates compiled by S&P Capital IQ anticipated $0.57 per share. GAAP EPS of $0.57 for Q1 were 3.6% higher than the prior-year quarter’s $0.55 per share.

Hennessey Venom GT

Source: S&P Capital IQ. Quarterly periods. Non-GAAP figures may vary to maintain comparability with estimates.

Margin details
For the quarter, gross margin was 38.7%, 50 basis points worse than the prior-year quarter. Operating margin was 12.0%, 40 basis points worse than the prior-year quarter. Net margin was 8.1%, 10 basis points worse than the prior-year quarter. (Margins calculated in GAAP terms.)

Looking ahead
Next quarter’s average estimate for revenue is $1.02 billion. On the bottom line, the average EPS estimate is $0.61.

Next year’s average estimate for revenue is $4.22 billion. The average EPS estimate is $3.20.

Investor sentiment
The stock has a four-star rating (out of five) at Motley Fool CAPS, with 410 members out of 428 rating the stock outperform, and 18 members rating it underperform. Among 174 CAPS All-Star picks (recommendations by the highest-ranked CAPS members), 171 give McCormick a green thumbs-up, and three give it a red thumbs-down.

Of Wall Street recommendations tracked by S&P Capital IQ, the average opinion on McCormick is hold, with an average price target of $64.27.

The rich are different than you and me: They might not notice the moneymaking stories right under our noses. In our new report, “Middle-Class Millionaire-Makers: 3 Stocks Wall Street’s Too Rich to Notice,” we give you three Peter Lynch-inspired buy-what-you-know stocks for the 99%. Click here for instant access to this free report.

The article McCormick Beats on Revenue, Matches Expectations on EPS originally appeared on Fool.com.


Seth Jayson had no position in any company mentioned here at the time of …read more
Source: FULL ARTICLE at DailyFinance

What to Expect from Landec

By Seth Jayson, The Motley Fool

Filed under:

Landec (NAS: LNDC) is expected to report Q3 earnings on March 26. Here’s what Wall Street wants to see:

The 10-second takeaway
Comparing the upcoming quarter to the prior-year quarter, average analyst estimates predict Landec’s revenues will grow 35.9% and EPS will wane -5.6%.

The average estimate for revenue is $108.8 million. On the bottom line, the average EPS estimate is $0.17.

Revenue details
Last quarter, Landec logged revenue of $114.7 million. GAAP reported sales were 41% higher than the prior-year quarter’s $81.6 million.

Source: S&P Capital IQ. Quarterly periods. Dollar amounts in millions. Non-GAAP figures may vary to maintain comparability with estimates.

EPS details
Last quarter, non-GAAP EPS came in at $0.19. GAAP EPS of $0.34 for Q2 were 162% higher than the prior-year quarter’s $0.13 per share.

Source: S&P Capital IQ. Quarterly periods. Non-GAAP figures may vary to maintain comparability with estimates.

Recent performance
For the preceding quarter, gross margin was 16.1%, 20 basis points better than the prior-year quarter. Operating margin was 6.2%, 100 basis points better than the prior-year quarter. Net margin was 7.8%, 370 basis points better than the prior-year quarter.

Looking ahead

The full year’s average estimate for revenue is $431.9 million. The average EPS estimate is $0.78.

Investor sentiment
The stock has a three-star rating (out of five) at Motley Fool CAPS, with 910 members out of 935 rating the stock outperform, and 25 members rating it underperform. Among 291 CAPS All-Star picks (recommendations by the highest-ranked CAPS members), 288 give Landec a green thumbs-up, and three give it a red thumbs-down.

Of Wall Street recommendations tracked by S&P Capital IQ, the average opinion on Landec is buy, with an average price target of $13.88.

The rich are different than you and me: They might not notice the moneymaking stories right under our noses. In our new report, “Middle-Class Millionaire-Makers: 3 Stocks Wall Street‘s Too Rich to Notice,” we give you three Peter Lynch-inspired buy-what-you-know stocks for the 99%. Click here for instant access to this free report.

The article What to Expect from Landec originally appeared on Fool.com.


Seth Jayson had no position in any company mentioned here at the time of publication. You can view his stock holdings here. He is co-advisor of
Motley Fool Hidden Gems, which provides new small-cap ideas every month, backed by a real-money portfolio. The Motley Fool has no position in any of the stocks mentioned. Try any of our Foolish …read more
Source: FULL ARTICLE at DailyFinance

It's Showtime for Lindsay

By Seth Jayson, The Motley Fool

Filed under:

Lindsay (NYS: LNN) is expected to report Q2 earnings on March 27. Here’s what Wall Street wants to see:

The 10-second takeaway
Comparing the upcoming quarter to the prior-year quarter, average analyst estimates predict Lindsay’s revenues will expand 22.9% and EPS will grow 29.0%.

The average estimate for revenue is $162.4 million. On the bottom line, the average EPS estimate is $1.29.

Revenue details
Last quarter, Lindsay recorded revenue of $147.4 million. GAAP reported sales were 24% higher than the prior-year quarter’s $119.2 million.

Source: S&P Capital IQ. Quarterly periods. Dollar amounts in millions. Non-GAAP figures may vary to maintain comparability with estimates.

EPS details
Last quarter, EPS came in at $1.15. GAAP EPS of $1.15 for Q1 were 400% higher than the prior-year quarter’s $0.23 per share.

Source: S&P Capital IQ. Quarterly periods. Non-GAAP figures may vary to maintain comparability with estimates.

Recent performance
For the preceding quarter, gross margin was 29.1%, 370 basis points better than the prior-year quarter. Operating margin was 15.1%, much better than the prior-year quarter. Net margin was 10.0%, 750 basis points better than the prior-year quarter.

Looking ahead

The full year’s average estimate for revenue is $638.9 million. The average EPS estimate is $4.86.

Investor sentiment
The stock has a four-star rating (out of five) at Motley Fool CAPS, with 308 members out of 337 rating the stock outperform, and 29 members rating it underperform. Among 83 CAPS All-Star picks (recommendations by the highest-ranked CAPS members), 76 give Lindsay a green thumbs-up, and seven give it a red thumbs-down.

Of Wall Street recommendations tracked by S&P Capital IQ, the average opinion on Lindsay is hold, with an average price target of $71.20.

The rich are different than you and me: They might not notice the moneymaking stories right under our noses. In our new report, “Middle-Class Millionaire-Makers: 3 Stocks Wall Street‘s Too Rich to Notice,” we give you three Peter Lynch-inspired buy-what-you-know stocks for the 99%. Click here for instant access to this free report.

The article It’s Showtime for Lindsay originally appeared on Fool.com.


Seth Jayson had no position in any company mentioned here at the time of publication. You can view his stock holdings here. He is co-advisor of
Motley Fool Hidden Gems, which provides new small-cap ideas every month, backed by a real-money portfolio. The Motley Fool has no position in any of the stocks mentioned. Try any of our Foolish newsletter services free …read more
Source: FULL ARTICLE at DailyFinance

What Does Wall Street See for Herman Miller's Q3?

By Seth Jayson, The Motley Fool

Filed under:

Herman Miller (NAS: MLHR) is expected to report Q3 earnings around March 20. Here’s what Wall Street wants to see:

The 10-second takeaway
Comparing the upcoming quarter to the prior-year quarter, average analyst estimates predict Herman Miller‘s revenues will grow 9.5% and EPS will grow 7.7%.

The average estimate for revenue is $437.7 million. On the bottom line, the average EPS estimate is $0.28.

Revenue details
Last quarter, Herman Miller chalked up revenue of $441.8 million. GAAP reported sales were 0.9% lower than the prior-year quarter’s $445.6 million.

Source: S&P Capital IQ. Quarterly periods. Dollar amounts in millions. Non-GAAP figures may vary to maintain comparability with estimates.

EPS details
Last quarter, non-GAAP EPS came in at $0.35. GAAP EPS of $0.14 for Q2 were 66% lower than the prior-year quarter’s $0.41 per share.

Source: S&P Capital IQ. Quarterly periods. Non-GAAP figures may vary to maintain comparability with estimates.

Recent performance
For the preceding quarter, gross margin was 33.6%, 50 basis points worse than the prior-year quarter. Operating margin was 4.1%, 500 basis points worse than the prior-year quarter. Net margin was 1.9%, 340 basis points worse than the prior-year quarter.

Looking ahead

The full year’s average estimate for revenue is $1.78 billion. The average EPS estimate is $1.37.

Investor sentiment
The stock has a five-star rating (out of five) at Motley Fool CAPS, with 120 members out of 132 rating the stock outperform, and 12 members rating it underperform. Among 44 CAPS All-Star picks (recommendations by the highest-ranked CAPS members), 42 give Herman Miller a green thumbs-up, and two give it a red thumbs-down.

Of Wall Street recommendations tracked by S&P Capital IQ, the average opinion on Herman Miller is outperform, with an average price target of $29.00.

The rich are different than you and me: They might not notice the moneymaking stories right under our noses. In our new report, “Middle-Class Millionaire-Makers: 3 Stocks Wall Street‘s Too Rich to Notice,” we give you three Peter Lynch-inspired buy-what-you-know stocks for the 99%. Click here for instant access to this free report.

The article What Does Wall Street See for Herman Miller’s Q3? originally appeared on Fool.com.


Seth Jayson had no position in any company mentioned here at the time of publication. You can view his stock holdings here. He is co-advisor of
Motley Fool Hidden Gems, which provides new small-cap ideas every month, backed by a real-money portfolio. The Motley Fool has no position …read more
Source: FULL ARTICLE at DailyFinance

Will These Numbers from Winnebago Industries Be Good Enough for You?

By Seth Jayson, The Motley Fool

Filed under:

Winnebago Industries (NYS: WGO) is expected to report Q2 earnings around March 21. Here’s what Wall Street wants to see:

The 10-second takeaway
Comparing the upcoming quarter to the prior-year quarter, average analyst estimates predict Winnebago Industries‘s revenues will expand 29.8% and EPS will turn positive

The average estimate for revenue is $170.9 million. On the bottom line, the average EPS estimate is $0.14.

Revenue details
Last quarter, Winnebago Industries reported revenue of $193.6 million. GAAP reported sales were 47% higher than the prior-year quarter’s $131.8 million.

Source: S&P Capital IQ. Quarterly periods. Dollar amounts in millions. Non-GAAP figures may vary to maintain comparability with estimates.

EPS details
Last quarter, EPS came in at $0.26. GAAP EPS of $0.26 for Q1 were much higher than the prior-year quarter’s $0.04 per share.

Source: S&P Capital IQ. Quarterly periods. Non-GAAP figures may vary to maintain comparability with estimates.

Recent performance
For the preceding quarter, gross margin was 10.7%, 430 basis points better than the prior-year quarter. Operating margin was 5.2%, 470 basis points better than the prior-year quarter. Net margin was 3.8%, 300 basis points better than the prior-year quarter.

Looking ahead

The full year’s average estimate for revenue is $730.9 million. The average EPS estimate is $0.80.

Investor sentiment
The stock has a two-star rating (out of five) at Motley Fool CAPS, with 142 members out of 275 rating the stock outperform, and 133 members rating it underperform. Among 81 CAPS All-Star picks (recommendations by the highest-ranked CAPS members), 53 give Winnebago Industries a green thumbs-up, and 28 give it a red thumbs-down.

Of Wall Street recommendations tracked by S&P Capital IQ, the average opinion on Winnebago Industries is outperform, with an average price target of $16.00.

The rich are different than you and me: They might not notice the moneymaking stories right under our noses. In our new report, “Middle-Class Millionaire-Makers: 3 Stocks Wall Street‘s Too Rich to Notice,” we give you three Peter Lynch-inspired buy-what-you-know stocks for the 99%. Click here for instant access to this free report.

The article Will These Numbers from Winnebago Industries Be Good Enough for You? originally appeared on Fool.com.


Seth Jayson owned shares of the following at the time of publication: Winnebago Industries. You can view his stock holdings here. He is co-advisor of
Motley Fool Hidden Gems, which provides new small-cap ideas every month, backed by a real-money portfolio. The Motley Fool owns shares of Winnebago …read more
Source: FULL ARTICLE at DailyFinance

It's Showtime for Lennar

By Seth Jayson, The Motley Fool

Filed under:

Lennar (NYS: LEN) is expected to report Q1 earnings on March 20. Here’s what Wall Street wants to see:

The 10-second takeaway
Comparing the upcoming quarter to the prior-year quarter, average analyst estimates predict Lennar’s revenues will expand 28.4% and EPS will expand 100.0%.

The average estimate for revenue is $931.0 million. On the bottom line, the average EPS estimate is $0.16.

Revenue details
Last quarter, Lennar logged revenue of $1.35 billion. GAAP reported sales were 42% higher than the prior-year quarter’s $952.7 million.

Source: S&P Capital IQ. Quarterly periods. Dollar amounts in millions. Non-GAAP figures may vary to maintain comparability with estimates.

EPS details
Last quarter, non-GAAP EPS came in at $0.36. GAAP EPS of $0.56 for Q4 were 250% higher than the prior-year quarter’s $0.16 per share.

Source: S&P Capital IQ. Quarterly periods. Non-GAAP figures may vary to maintain comparability with estimates.

Recent performance
For the preceding quarter, gross margin was 25.7%, 290 basis points better than the prior-year quarter. Operating margin was 12.6%, 540 basis points better than the prior-year quarter. Net margin was 9.2%, 600 basis points better than the prior-year quarter.

Looking ahead

The full year’s average estimate for revenue is $5.56 billion. The average EPS estimate is $1.68.

Investor sentiment
The stock has a two-star rating (out of five) at Motley Fool CAPS, with 538 members out of 1,228 rating the stock outperform, and 690 members rating it underperform. Among 363 CAPS All-Star picks (recommendations by the highest-ranked CAPS members), 178 give Lennar a green thumbs-up, and 185 give it a red thumbs-down.

Of Wall Street recommendations tracked by S&P Capital IQ, the average opinion on Lennar is hold, with an average price target of $37.47.

The rich are different than you and me: They might not notice the moneymaking stories right under our noses. In our new report, “Middle-Class Millionaire-Makers: 3 Stocks Wall Street‘s Too Rich to Notice,” we give you three Peter Lynch-inspired buy-what-you-know stocks for the 99%. Click here for instant access to this free report.

The article It’s Showtime for Lennar originally appeared on Fool.com.


Seth Jayson had no position in any company mentioned here at the time of publication. You can view his stock holdings here. He is co-advisor of
Motley Fool Hidden Gems, which provides new small-cap ideas every month, backed by a real-money portfolio. The Motley Fool has no position in any of the stocks mentioned. Try any of our Foolish newsletter …read more
Source: FULL ARTICLE at DailyFinance

What Does Wall Street See for EnergySolutions's Q4?

By Seth Jayson, The Motley Fool

Filed under:

EnergySolutions (NYS: ES) is expected to report Q4 earnings around March 21. Here’s what Wall Street wants to see:

The 10-second takeaway
Comparing the upcoming quarter to the prior-year quarter, average analyst estimates predict EnergySolutions’s revenues will compress -1.9% and EPS will turn positive

The average estimate for revenue is $459.6 million. On the bottom line, the average EPS estimate is $0.16.

Revenue details
Last quarter, EnergySolutions notched revenue of $444.2 million. GAAP reported sales were 5.5% higher than the prior-year quarter’s $421.0 million.

Source: S&P Capital IQ. Quarterly periods. Dollar amounts in millions. Non-GAAP figures may vary to maintain comparability with estimates.

EPS details
Last quarter, non-GAAP EPS came in at $0.17. GAAP EPS were $0.11 for Q3 compared to -$0.04 per share for the prior-year quarter.

Source: S&P Capital IQ. Quarterly periods. Non-GAAP figures may vary to maintain comparability with estimates.

Recent performance
For the preceding quarter, gross margin was 10.4%, 160 basis points better than the prior-year quarter. Operating margin was 4.0%, 280 basis points better than the prior-year quarter. Net margin was 2.3%, 320 basis points better than the prior-year quarter.

Looking ahead

The full year’s average estimate for revenue is $1.79 billion. The average EPS estimate is $0.44.

Investor sentiment
The stock has a five-star rating (out of five) at Motley Fool CAPS, with 790 members out of 820 rating the stock outperform, and 30 members rating it underperform. Among 183 CAPS All-Star picks (recommendations by the highest-ranked CAPS members), 178 give EnergySolutions a green thumbs-up, and five give it a red thumbs-down.

Of Wall Street recommendations tracked by S&P Capital IQ, the average opinion on EnergySolutions is hold, with an average price target of $4.60.

The rich are different than you and me: They might not notice the moneymaking stories right under our noses. In our new report, “Middle-Class Millionaire-Makers: 3 Stocks Wall Street‘s Too Rich to Notice,” we give you three Peter Lynch-inspired buy-what-you-know stocks for the 99%. Click here for instant access to this free report.

The article What Does Wall Street See for EnergySolutions’s Q4? originally appeared on Fool.com.


Seth Jayson had no position in any company mentioned here at the time of publication. You can view his stock holdings here. He is co-advisor of
Motley Fool Hidden Gems, which provides new small-cap ideas every month, backed by a real-money portfolio. The Motley Fool has no position in any of the stocks mentioned. Try any of …read more
Source: FULL ARTICLE at DailyFinance

Does The Street Have KB Home Figured Out?

By Seth Jayson, The Motley Fool

Filed under:

KB Home (NYS: KBH) is expected to report Q1 earnings on March 21. Here’s what Wall Street wants to see:

The 10-second takeaway
Comparing the upcoming quarter to the prior-year quarter, average analyst estimates predict KB Home’s revenues will grow 36.4% and EPS will remain in the red.

The average estimate for revenue is $347.1 million. On the bottom line, the average EPS estimate is -$0.22.

Revenue details
Last quarter, KB Home logged revenue of $578.2 million. GAAP reported sales were 20% higher than the prior-year quarter’s $479.9 million.

Source: S&P Capital IQ. Quarterly periods. Dollar amounts in millions. Non-GAAP figures may vary to maintain comparability with estimates.

EPS details
Last quarter, non-GAAP EPS came in at $0.14. GAAP EPS of $0.10 for Q4 were 44% lower than the prior-year quarter’s $0.18 per share.

Source: S&P Capital IQ. Quarterly periods. Non-GAAP figures may vary to maintain comparability with estimates.

Recent performance
For the preceding quarter, gross margin was 15.6%, 420 basis points worse than the prior-year quarter. Operating margin was 4.2%, 20 basis points better than the prior-year quarter. Net margin was 1.3%, 160 basis points worse than the prior-year quarter.

Looking ahead

The full year’s average estimate for revenue is $2.03 billion. The average EPS estimate is $0.14.

Investor sentiment
The stock has a two-star rating (out of five) at Motley Fool CAPS, with 582 members out of 1,255 rating the stock outperform, and 673 members rating it underperform. Among 336 CAPS All-Star picks (recommendations by the highest-ranked CAPS members), 158 give KB Home a green thumbs-up, and 178 give it a red thumbs-down.

Of Wall Street recommendations tracked by S&P Capital IQ, the average opinion on KB Home is hold, with an average price target of $14.52.

The rich are different than you and me: They might not notice the moneymaking stories right under our noses. In our new report, “Middle-Class Millionaire-Makers: 3 Stocks Wall Street‘s Too Rich to Notice,” we give you three Peter Lynch-inspired buy-what-you-know stocks for the 99%. Click here for instant access to this free report.

The article Does The Street Have KB Home Figured Out? originally appeared on Fool.com.


Seth Jayson had no position in any company mentioned here at the time of publication. You can view his stock holdings here. He is co-advisor of
Motley Fool Hidden Gems, which provides new small-cap ideas every month, backed by a real-money portfolio. The Motley Fool has no position …read more
Source: FULL ARTICLE at DailyFinance

Cintas Earnings Are on Deck

By Seth Jayson, The Motley Fool

Filed under:

Cintas (NAS: CTAS) is expected to report Q3 earnings on March 19. Here’s what Wall Street wants to see:

The 10-second takeaway
Comparing the upcoming quarter to the prior-year quarter, average analyst estimates predict Cintas’s revenues will expand 4.3% and EPS will grow 6.9%.

The average estimate for revenue is $1.06 billion. On the bottom line, the average EPS estimate is $0.62.

Revenue details
Last quarter, Cintas booked revenue of $1.06 billion. GAAP reported sales were 4.0% higher than the prior-year quarter’s $1.02 billion.

Source: S&P Capital IQ. Quarterly periods. Dollar amounts in millions. Non-GAAP figures may vary to maintain comparability with estimates.

EPS details
Last quarter, non-GAAP EPS came in at $0.63. GAAP EPS of $0.62 for Q2 were 8.8% higher than the prior-year quarter’s $0.57 per share.

Source: S&P Capital IQ. Quarterly periods. Non-GAAP figures may vary to maintain comparability with estimates.

Recent performance
For the preceding quarter, gross margin was 40.9%, 130 basis points worse than the prior-year quarter. Operating margin was 13.3%, 30 basis points better than the prior-year quarter. Net margin was 7.4%, 10 basis points better than the prior-year quarter.

Looking ahead

The full year’s average estimate for revenue is $4.28 billion. The average EPS estimate is $2.54.

Investor sentiment
The stock has a five-star rating (out of five) at Motley Fool CAPS, with 363 members out of 386 rating the stock outperform, and 23 members rating it underperform. Among 167 CAPS All-Star picks (recommendations by the highest-ranked CAPS members), 164 give Cintas a green thumbs-up, and three give it a red thumbs-down.

Of Wall Street recommendations tracked by S&P Capital IQ, the average opinion on Cintas is hold, with an average price target of $42.29.

The rich are different than you and me: They might not notice the moneymaking stories right under our noses. In our new report, “Middle-Class Millionaire-Makers: 3 Stocks Wall Street‘s Too Rich to Notice,” we give you three Peter Lynch-inspired buy-what-you-know stocks for the 99%. Click here for instant access to this free report.

The article Cintas Earnings Are on Deck originally appeared on Fool.com.


Seth Jayson had no position in any company mentioned here at the time of publication. You can view his stock holdings here. He is co-advisor of
Motley Fool Hidden Gems, which provides new small-cap ideas every month, backed by a real-money portfolio. The Motley Fool recommends Cintas. Try any of our Foolish newsletter services free for 30 days. …read more
Source: FULL ARTICLE at DailyFinance

Fool Checkup: Chiquita Brands International Earnings

By Seth Jayson, The Motley Fool

Filed under:

Chiquita Brands International (NYS: CQB) reported earnings on March 11. Here are the numbers you need to know.

The 10-second takeaway
For the quarter ended Dec. 31 (Q4), Chiquita Brands International met expectations on revenues and exceeded expectations on earnings per share.

Compared to the prior-year quarter, revenue increased slightly. Non-GAAP loss per share grew. GAAP loss per share increased.

Margins contracted across the board.

Revenue details
Chiquita Brands International logged revenue of $738.0 million. The one analyst polled by S&P Capital IQ expected revenue of $737.8 million on the same basis. GAAP reported sales were the same as the prior-year quarter’s.

Source: S&P Capital IQ. Quarterly periods. Dollar amounts in millions. Non-GAAP figures may vary to maintain comparability with estimates.

EPS details
EPS came in at -$0.24. The two earnings estimates compiled by S&P Capital IQ predicted -$0.34 per share. Non-GAAP EPS were -$0.24 for Q4 versus -$0.12 per share for the prior-year quarter. GAAP EPS were -$7.24 for Q4 compared to -$0.36 per share for the prior-year quarter.

Source: S&P Capital IQ. Quarterly periods. Non-GAAP figures may vary to maintain comparability with estimates.

Margin details
For the quarter, gross margin was 9.6%, 60 basis points worse than the prior-year quarter. Operating margin was -2.3%, 150 basis points worse than the prior-year quarter. Net margin was -45.4%, much worse than the prior-year quarter. (Margins calculated in GAAP terms.)

Looking ahead
Next quarter’s average estimate for revenue is $826.8 million. On the bottom line, the average EPS estimate is $0.20.

Next year’s average estimate for revenue is $3.11 billion. The average EPS estimate is $0.80.

Investor sentiment
The stock has a four-star rating (out of five) at Motley Fool CAPS, with 272 members out of 316 rating the stock outperform, and 44 members rating it underperform. Among 73 CAPS All-Star picks (recommendations by the highest-ranked CAPS members), 62 give Chiquita Brands International a green thumbs-up, and 11 give it a red thumbs-down.

Of Wall Street recommendations tracked by S&P Capital IQ, the average opinion on Chiquita Brands International is outperform, with an average price target of $12.00.

The rich are different than you and me: They might not notice the moneymaking stories right under our noses. In our new report, “Middle-Class Millionaire-Makers: 3 Stocks Wall Street’s Too Rich to Notice,” we give you three Peter Lynch-inspired buy-what-you-know stocks for the 99%. Click here for instant access to this free report.

The article Fool Checkup: Chiquita Brands International Earnings originally appeared …read more
Source: FULL ARTICLE at DailyFinance

Does The Street Have Federal Signal Figured Out?

By Seth Jayson, The Motley Fool

Filed under:

Federal Signal (NYS: FSS) is expected to report Q4 earnings on March 15. Here’s what Wall Street wants to see:

The 10-second takeaway
Comparing the upcoming quarter to the prior-year quarter, average analyst estimates predict Federal Signal‘s revenues will shrink -6.7% and EPS will grow 22.2%.

The average estimate for revenue is $208.4 million. On the bottom line, the average EPS estimate is $0.11.

Revenue details
Last quarter, Federal Signal tallied revenue of $185.0 million. GAAP reported sales were 10% higher than the prior-year quarter’s $167.8 million.

Source: S&P Capital IQ. Quarterly periods. Dollar amounts in millions. Non-GAAP figures may vary to maintain comparability with estimates.

EPS details
Last quarter, non-GAAP EPS came in at $0.09. GAAP EPS were -$0.23 for Q3 against $0.04 per share for the prior-year quarter.

Source: S&P Capital IQ. Quarterly periods. Non-GAAP figures may vary to maintain comparability with estimates.

Recent performance
For the preceding quarter, gross margin was 24.6%, 280 basis points better than the prior-year quarter. Operating margin was 6.7%, 160 basis points better than the prior-year quarter. Net margin was -7.9%, 930 basis points worse than the prior-year quarter.

Looking ahead

The full year’s average estimate for revenue is $822.4 million. The average EPS estimate is $0.40.

Investor sentiment
The stock has a three-star rating (out of five) at Motley Fool CAPS, with 67 members out of 81 rating the stock outperform, and 14 members rating it underperform. Among 22 CAPS All-Star picks (recommendations by the highest-ranked CAPS members), 20 give Federal Signal a green thumbs-up, and two give it a red thumbs-down.

Of Wall Street recommendations tracked by S&P Capital IQ, the average opinion on Federal Signal is hold, with an average price target of $7.00.

The rich are different than you and me: They might not notice the moneymaking stories right under our noses. In our new report, “Middle-Class Millionaire-Makers: 3 Stocks Wall Street‘s Too Rich to Notice,” we give you three Peter Lynch-inspired buy-what-you-know stocks for the 99%. Click here for instant access to this free report.

The article Does The Street Have Federal Signal Figured Out? originally appeared on Fool.com.


Seth Jayson had no position in any company mentioned here at the time of publication. You can view his stock holdings here. He is co-advisor of
Motley Fool Hidden Gems, which provides new small-cap ideas every month, backed by a real-money portfolio. The Motley Fool has no position in any of the …read more
Source: FULL ARTICLE at DailyFinance

Fuel Systems Solutions Beats on Both Top and Bottom Lines

By Seth Jayson, The Motley Fool

Filed under:

Fuel Systems Solutions (NAS: FSYS) reported earnings on March 8. Here are the numbers you need to know.

The 10-second takeaway
For the quarter ended Dec. 31 (Q4), Fuel Systems Solutions beat expectations on revenues and beat expectations on earnings per share.

Compared to the prior-year quarter, revenue shrank. Non-GAAP earnings per share dropped significantly. GAAP earnings per share shrank to a loss.

Gross margins were steady, operating margins dropped, net margins dropped.

Revenue details
Fuel Systems Solutions chalked up revenue of $98.0 million. The eight analysts polled by S&P Capital IQ looked for net sales of $88.8 million on the same basis. GAAP reported sales were 12% lower than the prior-year quarter’s $111.0 million.

Source: S&P Capital IQ. Quarterly periods. Dollar amounts in millions. Non-GAAP figures may vary to maintain comparability with estimates.

EPS details
EPS came in at $0.01. The eight earnings estimates compiled by S&P Capital IQ averaged -$0.03 per share. Non-GAAP EPS of $0.01 for Q4 were 86% lower than the prior-year quarter’s $0.07 per share. GAAP EPS were -$1.05 for Q4 against $0.07 per share for the prior-year quarter.

Source: S&P Capital IQ. Quarterly periods. Non-GAAP figures may vary to maintain comparability with estimates.

Margin details
For the quarter, gross margin was 21.8%, much about the same as the prior-year quarter. Operating margin was 1.3%, 40 basis points worse than the prior-year quarter. Net margin was -21.4%, much worse than the prior-year quarter. (Margins calculated in GAAP terms.)

Looking ahead
Next quarter’s average estimate for revenue is $93.9 million. On the bottom line, the average EPS estimate is $0.10.

Next year’s average estimate for revenue is $414.1 million. The average EPS estimate is $0.58.

Investor sentiment
The stock has a four-star rating (out of five) at Motley Fool CAPS, with 471 members out of 531 rating the stock outperform, and 60 members rating it underperform. Among 104 CAPS All-Star picks (recommendations by the highest-ranked CAPS members), 81 give Fuel Systems Solutions a green thumbs-up, and 23 give it a red thumbs-down.

Of Wall Street recommendations tracked by S&P Capital IQ, the average opinion on Fuel Systems Solutions is hold, with an average price target of $19.83.

The rich are different than you and me: They might not notice the moneymaking stories right under our noses. In our new report, “Middle-Class Millionaire-Makers: 3 Stocks Wall Street’s Too Rich to Notice,” we give you three Peter Lynch-inspired buy-what-you-know stocks for the 99%. Click here for instant access to this free report.

The …read more
Source: FULL ARTICLE at DailyFinance

Thor Industries Misses Where it Counts

By Seth Jayson, The Motley Fool

Filed under:

Thor Industries (NYS: THO) reported earnings on March 7. Here are the numbers you need to know.

The 10-second takeaway
For the quarter ended Jan. 31 (Q2), Thor Industries met expectations on revenues and missed estimates on earnings per share.

Compared to the prior-year quarter, revenue grew significantly. GAAP earnings per share grew significantly.

Gross margins were steady, operating margins dropped, net margins grew.

Revenue details
Thor Industries recorded revenue of $741.6 million. The four analysts polled by S&P Capital IQ expected revenue of $741.4 million on the same basis. GAAP reported sales were 24% higher than the prior-year quarter’s $597.0 million.

Source: S&P Capital IQ. Quarterly periods. Dollar amounts in millions. Non-GAAP figures may vary to maintain comparability with estimates.

EPS details
EPS came in at $0.37. The four earnings estimates compiled by S&P Capital IQ forecast $0.38 per share. GAAP EPS of $0.37 for Q2 were 48% higher than the prior-year quarter’s $0.25 per share.

Source: S&P Capital IQ. Quarterly periods. Non-GAAP figures may vary to maintain comparability with estimates.

Margin details
For the quarter, gross margin was 9.9%, much about the same as the prior-year quarter. Operating margin was 3.3%, 10 basis points worse than the prior-year quarter. Net margin was 2.7%, 40 basis points better than the prior-year quarter. (Margins calculated in GAAP terms.)

Looking ahead
Next quarter’s average estimate for revenue is $1.05 billion. On the bottom line, the average EPS estimate is $0.93.

Next year’s average estimate for revenue is $3.66 billion. The average EPS estimate is $2.88.

Investor sentiment
The stock has a three-star rating (out of five) at Motley Fool CAPS, with 209 members out of 243 rating the stock outperform, and 34 members rating it underperform. Among 75 CAPS All-Star picks (recommendations by the highest-ranked CAPS members), 71 give Thor Industries a green thumbs-up, and four give it a red thumbs-down.

Of Wall Street recommendations tracked by S&P Capital IQ, the average opinion on Thor Industries is buy, with an average price target of $49.75.

If you’re looking for an edge in the transportation segment of the market, consider strong, smaller brands that sell their products to folks like you and me. We’ve got a couple to offer, plus a home-owner’s trusted go-to company, in our new special report, “Middle-Class Millionaire-Makers: 3 Stocks Wall Street’s Too Rich to Notice.” Click here for instant access to this free report.

The article Thor Industries Misses Where it Counts originally appeared on Fool.com.


…read more
Source: FULL ARTICLE at DailyFinance

SunOpta Increases Sales but Misses Estimates on Earnings

By Seth Jayson, The Motley Fool

Filed under:

SunOpta (NAS: STKL) reported earnings on March 5. Here are the numbers you need to know.

The 10-second takeaway
For the quarter ended Dec. 29 (Q4), SunOpta beat expectations on revenues and missed estimates on earnings per share.

Compared to the prior-year quarter, revenue increased. Non-GAAP earnings per share expanded. GAAP earnings per share increased.

Gross margins shrank, operating margins expanded, net margins increased.

Revenue details
SunOpta logged revenue of $270.1 million. The six analysts polled by S&P Capital IQ looked for net sales of $263.5 million on the same basis. GAAP reported sales were the same as the prior-year quarter’s.

Source: S&P Capital IQ. Quarterly periods. Dollar amounts in millions. Non-GAAP figures may vary to maintain comparability with estimates.

EPS details
EPS came in at $0.08. The nine earnings estimates compiled by S&P Capital IQ predicted $0.09 per share. Non-GAAP EPS of $0.08 for Q4 were 14% higher than the prior-year quarter’s $0.07 per share. (The prior-year quarter included -$0.05 per share in earnings from discontinued operations.) GAAP EPS were $0.06 for Q4 versus -$0.12 per share for the prior-year quarter.

Source: S&P Capital IQ. Quarterly periods. Non-GAAP figures may vary to maintain comparability with estimates.

Margin details
For the quarter, gross margin was 10.7%, 70 basis points worse than the prior-year quarter. Operating margin was 2.5%, 50 basis points better than the prior-year quarter. Net margin was 1.6%, 450 basis points better than the prior-year quarter.

Looking ahead
Next quarter’s average estimate for revenue is $283.4 million. On the bottom line, the average EPS estimate is $0.11.

Next year’s average estimate for revenue is $1.17 billion. The average EPS estimate is $0.47.

Investor sentiment
The stock has a one-star rating (out of five) at Motley Fool CAPS, with 226 members out of 328 rating the stock outperform, and 102 members rating it underperform. Among 82 CAPS All-Star picks (recommendations by the highest-ranked CAPS members), 32 give SunOpta a green thumbs-up, and 50 give it a red thumbs-down.

Of Wall Street recommendations tracked by S&P Capital IQ, the average opinion on SunOpta is outperform, with an average price target of $8.31.

The rich are different than you and me: They might not notice the moneymaking stories right under our noses. In our new report, “Middle-Class Millionaire-Makers: 3 Stocks Wall Street’s Too Rich to Notice,” we give you three Peter Lynch-inspired buy-what-you-know stocks for the 99%. Click here for instant access to this free report.

The article SunOpta Increases Sales but Misses Estimates on Earnings originally …read more
Source: FULL ARTICLE at DailyFinance

Down 27%: Impax Labs' Massive Drop

By Max Macaluso, Ph.D., The Motley Fool

Filed under:

Shares of Impax Laboratories spiraled down more than 25% today after the company reported that the FDA continues to have concerns with one of its manufacturing facilities. This issue has already held up the potential approval of the company’s Parkinson’s disease drug, Rytary — a therapeutic that the company has partially licensed to pharma stalwart GlaxoSmithKline — which was rejected by the FDA in January. In the following video, health care analyst Max Macaluso sheds light on this story.

If you’re seeking companies with huge potential, our new free report “Middle-Class Millionaire-Makers: 3 Stocks Wall Street’s Too Rich to Notice” highlights three less-than-luxurious stocks the market is ignoring. Click here to read it now.

The article Down 27%: Impax Labs’ Massive Drop originally appeared on Fool.com.


Max Macaluso, Ph.D. has no position in any stocks mentioned. The Motley Fool has no position in any of the stocks mentioned. Try any of our Foolish newsletter services free for 30 days. We Fools may not all hold the same opinions, but we all believe that considering a diverse range of insights makes us better investors. The Motley Fool has a disclosure policy.

Copyright © 1995 – 2013 The Motley Fool, LLC. All rights reserved. The Motley Fool has a disclosure policy.

(function(c,a){window.mixpanel=a;var b,d,h,e;b=c.createElement(“script”);
b.type=”text/javascript”;b.async=!0;b.src=(“https:”===c.location.protocol?”https:”:”http:”)+
‘//cdn.mxpnl.com/libs/mixpanel-2.2.min.js’;d=c.getElementsByTagName(“script”)[0];
d.parentNode.insertBefore(b,d);a._i=[];a.init=function(b,c,f){function d(a,b){
var c=b.split(“.”);2==c.length&&(a=a[c[0]],b=c[1]);a[b]=function(){a.push([b].concat(
Array.prototype.slice.call(arguments,0)))}}var g=a;”undefined”!==typeof f?g=a[f]=[]:
f=”mixpanel”;g.people=g.people||[];h=[‘disable’,’track’,’track_pageview’,’track_links’,
‘track_forms’,’register’,’register_once’,’unregister’,’identify’,’alias’,’name_tag’,
‘set_config’,’people.set’,’people.increment’];for(e=0;e<h.length;e++)d(g,h[e]);
a._i.push([b,c,f])};a.__SV=1.2;})(document,window.mixpanel||[]);
mixpanel.init("9659875b92ba8fa639ba476aedbb73b9");

function addEvent(obj, evType, fn, useCapture){
if (obj.addEventListener){
obj.addEventListener(evType, fn, useCapture);
return true;
} else if (obj.attachEvent){
var r = obj.attachEvent("on"+evType, fn);
return r;
}
}

addEvent(window, "load", function(){new FoolVisualSciences();})
addEvent(window, "load", function(){new PickAd();})

var themeName = 'dailyfinance.com';
var _gaq = _gaq || [];
_gaq.push(['_setAccount', 'UA-24928199-1']);
_gaq.push(['_trackPageview']);

(function () {

var ga = document.createElement('script');
ga.type = 'text/javascript';
ga.async = true;
ga.src = ('https:' == document.location.protocol ? 'https://ssl' : 'http://www') + '.google-analytics.com/ga.js';

var s = document.getElementsByTagName('script')[0];
s.parentNode.insertBefore(ga, s);
})();

Read | Permalink | Email this | Linking Blogs | Comments

…read more
Source: FULL ARTICLE at DailyFinance

Are You Expecting This from John Bean Technologies?

By Seth Jayson, The Motley Fool

Filed under:

John Bean Technologies (NYS: JBT) is expected to report Q4 earnings on March 6. Here’s what Wall Street wants to see:

The 10-second takeaway
Comparing the upcoming quarter to the prior-year quarter, average analyst estimates predict John Bean Technologies‘s revenues will grow 10.4% and EPS will expand 29.2%.

The average estimate for revenue is $299.8 million. On the bottom line, the average EPS estimate is $0.62.

Revenue details
Last quarter, John Bean Technologies reported revenue of $205.3 million. GAAP reported sales were 11% lower than the prior-year quarter’s $230.3 million.

Source: S&P Capital IQ. Quarterly periods. Dollar amounts in millions. Non-GAAP figures may vary to maintain comparability with estimates.

EPS details
Last quarter, EPS came in at $0.21. GAAP EPS of $0.21 for Q3 were 25% lower than the prior-year quarter’s $0.28 per share.

Source: S&P Capital IQ. Quarterly periods. Non-GAAP figures may vary to maintain comparability with estimates.

Recent performance
For the preceding quarter, gross margin was 25.3%, 50 basis points better than the prior-year quarter. Operating margin was 5.0%, 110 basis points worse than the prior-year quarter. Net margin was 3.0%, 50 basis points worse than the prior-year quarter.

Looking ahead

The full year’s average estimate for revenue is $923.2 million. The average EPS estimate is $1.23.

Investor sentiment
The stock has a four-star rating (out of five) at Motley Fool CAPS, with 101 members out of 104 rating the stock outperform, and three members rating it underperform. Among 42 CAPS All-Star picks (recommendations by the highest-ranked CAPS members), 42 give John Bean Technologies a green thumbs-up, and give it a red thumbs-down.

Of Wall Street recommendations tracked by S&P Capital IQ, the average opinion on John Bean Technologies is outperform, with an average price target of $19.33.

The rich are different than you and me: They might not notice the moneymaking stories right under our noses. In our new report, “Middle-Class Millionaire-Makers: 3 Stocks Wall Street‘s Too Rich to Notice,” we give you three Peter Lynch-inspired buy-what-you-know stocks for the 99%. Click here for instant access to this free report.

The article Are You Expecting This from John Bean Technologies? originally appeared on Fool.com.


Seth Jayson had no position in any company mentioned here at the time of publication. You can view his stock holdings here. He is co-advisor of
Motley Fool Hidden Gems, which provides new small-cap ideas every month, backed by a real-money portfolio. The Motley Fool owns shares of John Bean …read more
Source: FULL ARTICLE at DailyFinance