Tag Archives: Seth Jayson

Sun Hydraulics Beats on Both Top and Bottom Lines

By Seth Jayson, The Motley Fool

Filed under:

Sun Hydraulics (NAS: SNHY) reported earnings on March 4. Here are the numbers you need to know.

The 10-second takeaway
For the quarter ended Dec. 29 (Q4), Sun Hydraulics beat expectations on revenues and beat expectations on earnings per share.

Compared to the prior-year quarter, revenue dropped. GAAP earnings per share grew.

Gross margins grew, operating margins shrank, net margins expanded.

Revenue details
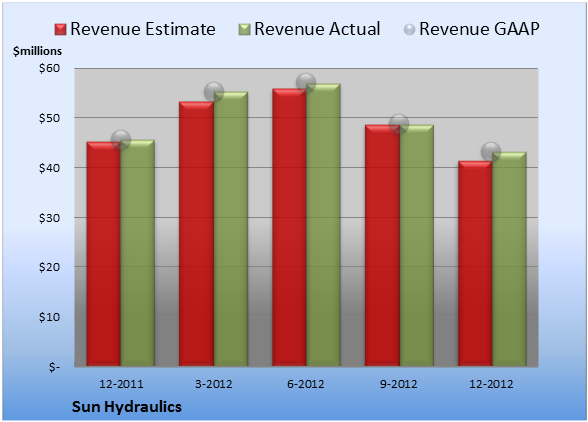
Sun Hydraulics reported revenue of $43.2 million. The three analysts polled by S&P Capital IQ expected sales of $41.4 million on the same basis. GAAP reported sales were 5.3% lower than the prior-year quarter’s $45.7 million.

Source: S&P Capital IQ. Quarterly periods. Dollar amounts in millions. Non-GAAP figures may vary to maintain comparability with estimates.

EPS details
EPS came in at $0.26. The three earnings estimates compiled by S&P Capital IQ averaged $0.23 per share. GAAP EPS of $0.26 for Q4 were 8.3% higher than the prior-year quarter’s $0.24 per share.

Source: S&P Capital IQ. Quarterly periods. Non-GAAP figures may vary to maintain comparability with estimates.

Margin details
For the quarter, gross margin was 37.0%, 10 basis points better than the prior-year quarter. Operating margin was 21.9%, 100 basis points worse than the prior-year quarter. Net margin was 15.5%, 220 basis points better than the prior-year quarter.

Looking ahead
Next quarter’s average estimate for revenue is $50.2 million. On the bottom line, the average EPS estimate is $0.34.

Next year’s average estimate for revenue is $204.0 million. The average EPS estimate is $1.40.

Investor sentiment
The stock has a five-star rating (out of five) at Motley Fool CAPS, with 1,308 members out of 1,325 rating the stock outperform, and 17 members rating it underperform. Among 406 CAPS All-Star picks (recommendations by the highest-ranked CAPS members), 404 give Sun Hydraulics a green thumbs-up, and two give it a red thumbs-down.

Of Wall Street recommendations tracked by S&P Capital IQ, the average opinion on Sun Hydraulics is hold, with an average price target of $28.50.

Looking for alternatives to Sun Hydraulics? It takes more than great companies to build a fortune for the future. Learn the basic financial habits of millionaires next door and get focused stock ideas in our free report, “3 Stocks That Will Help You Retire Rich.” Click here for instant access to this free report.

The article Sun Hydraulics Beats on Both Top and Bottom Lines originally appeared on Fool.com.


Seth Jayson had no position in any company mentioned here at …read more
Source: FULL ARTICLE at DailyFinance

Golar LNG Increases Sales but Misses Estimates on Earnings

By Seth Jayson, The Motley Fool

Filed under:

Golar LNG (NAS: GLNG) reported earnings on March 4. Here are the numbers you need to know.

The 10-second takeaway
For the quarter ended Dec. 31 (Q4), Golar LNG met expectations on revenues and missed estimates on earnings per share.

Compared to the prior-year quarter, revenue expanded significantly. GAAP earnings per share increased significantly.

Margins shrank across the board.

Revenue details
Golar LNG reported revenue of $111.8 million. The 11 analysts polled by S&P Capital IQ foresaw a top line of $111.2 million on the same basis. GAAP reported sales were 39% higher than the prior-year quarter’s $80.6 million.

Source: S&P Capital IQ. Quarterly periods. Dollar amounts in millions. Non-GAAP figures may vary to maintain comparability with estimates.

EPS details
EPS came in at $0.28. The 10 earnings estimates compiled by S&P Capital IQ forecast $0.45 per share. GAAP EPS of $0.28 for Q4 were 33% higher than the prior-year quarter’s $0.21 per share.

Source: S&P Capital IQ. Quarterly periods. Non-GAAP figures may vary to maintain comparability with estimates.

Margin details
For the quarter, gross margin was 74.9%, much worse than the prior-year quarter. Operating margin was 47.7%, 410 basis points worse than the prior-year quarter. Net margin was 20.4%, 90 basis points worse than the prior-year quarter.

Looking ahead
Next quarter’s average estimate for revenue is $110.7 million. On the bottom line, the average EPS estimate is $0.46.

Next year’s average estimate for revenue is $499.7 million. The average EPS estimate is $2.06.

Investor sentiment
The stock has a four-star rating (out of five) at Motley Fool CAPS, with 548 members out of 571 rating the stock outperform, and 23 members rating it underperform. Among 140 CAPS All-Star picks (recommendations by the highest-ranked CAPS members), 133 give Golar LNG a green thumbs-up, and seven give it a red thumbs-down.

Of Wall Street recommendations tracked by S&P Capital IQ, the average opinion on Golar LNG is outperform, with an average price target of $49.53.

Is Golar LNG the right energy stock for you? Read about a handful of timely, profit-producing plays on expensive crude in “3 Stocks for $100 Oil.” Click here for instant access to this free report.

The article Golar LNG Increases Sales but Misses Estimates on Earnings originally appeared on Fool.com.


Seth Jayson had no position in any company mentioned here at the time of publication. You can view his stock holdings here. He is co-advisor of
Motley Fool Hidden Gems, …read more
Source: FULL ARTICLE at DailyFinance

Santarus Beats on Both Top and Bottom Lines

By Seth Jayson, The Motley Fool

Filed under:

Santarus (NAS: SNTS) reported earnings on March 4. Here are the numbers you need to know.

The 10-second takeaway
For the quarter ended Dec. 31 (Q4), Santarus beat expectations on revenues and beat expectations on earnings per share.

Compared to the prior-year quarter, revenue grew significantly. GAAP earnings per share grew significantly.

Gross margins contracted, operating margins expanded, net margins grew.

Revenue details
Santarus chalked up revenue of $70.2 million. The five analysts polled by S&P Capital IQ predicted revenue of $62.0 million on the same basis. GAAP reported sales were 65% higher than the prior-year quarter’s $42.6 million.

Source: S&P Capital IQ. Quarterly periods. Dollar amounts in millions. Non-GAAP figures may vary to maintain comparability with estimates.

EPS details
EPS came in at $0.08. The five earnings estimates compiled by S&P Capital IQ anticipated $0.01 per share. GAAP EPS of $0.08 for Q4 were 167% higher than the prior-year quarter’s $0.03 per share.

Source: S&P Capital IQ. Quarterly periods. Non-GAAP figures may vary to maintain comparability with estimates.

Margin details
For the quarter, gross margin was 55.3%, much worse than the prior-year quarter. Operating margin was 8.7%, 290 basis points better than the prior-year quarter. Net margin was 7.8%, 330 basis points better than the prior-year quarter.

Looking ahead
Next quarter’s average estimate for revenue is $70.7 million. On the bottom line, the average EPS estimate is $0.13.

Next year’s average estimate for revenue is $323.1 million. The average EPS estimate is $0.70.

Investor sentiment
The stock has a four-star rating (out of five) at Motley Fool CAPS, with 138 members out of 151 rating the stock outperform, and 13 members rating it underperform. Among 31 CAPS All-Star picks (recommendations by the highest-ranked CAPS members), 27 give Santarus a green thumbs-up, and four give it a red thumbs-down.

Of Wall Street recommendations tracked by S&P Capital IQ, the average opinion on Santarus is buy, with an average price target of $11.19.

The article Santarus Beats on Both Top and Bottom Lines originally appeared on Fool.com.


Seth Jayson had no position in any company mentioned here at the time of publication. You can view his stock holdings here. He is co-advisor of
Motley Fool Hidden Gems, which provides new small-cap ideas every month, backed by a real-money portfolio. The Motley Fool has no position in any of the stocks mentioned. Try any of our Foolish newsletter services free for 30 days. We Fools may …read more
Source: FULL ARTICLE at DailyFinance

The Gory Details on Boyd Gaming's Double Fumble

By Seth Jayson, The Motley Fool

Filed under:

Boyd Gaming (NYS: BYD) reported earnings on March 4. Here are the numbers you need to know.

The 10-second takeaway
For the quarter ended Dec. 31 (Q4), Boyd Gaming missed slightly on revenues and missed expectations on earnings per share.

Compared to the prior-year quarter, revenue grew. Non-GAAP loss per share expanded. GAAP loss per share expanded.

Margins dropped across the board.

Revenue details
Boyd Gaming logged revenue of $625.8 million. The 15 analysts polled by S&P Capital IQ predicted sales of $637.5 million on the same basis. GAAP reported sales were the same as the prior-year quarter’s.

Source: S&P Capital IQ. Quarterly periods. Dollar amounts in millions. Non-GAAP figures may vary to maintain comparability with estimates.

EPS details
EPS came in at -$0.31. The 16 earnings estimates compiled by S&P Capital IQ predicted -$0.13 per share. Non-GAAP EPS were -$0.31 for Q4 against -$0.03 per share for the prior-year quarter. GAAP EPS were -$10.24 for Q4 compared to -$0.01 per share for the prior-year quarter.

Source: S&P Capital IQ. Quarterly periods. Non-GAAP figures may vary to maintain comparability with estimates.

Margin details
For the quarter, gross margin was 36.4%, much worse than the prior-year quarter. Operating margin was 2.5%, 730 basis points worse than the prior-year quarter. Net margin was -143.8%, much worse than the prior-year quarter.

Looking ahead
Next quarter’s average estimate for revenue is $760.6 million. On the bottom line, the average EPS estimate is $0.21.

Next year’s average estimate for revenue is $2.99 billion. The average EPS estimate is $0.45.

Investor sentiment
The stock has a three-star rating (out of five) at Motley Fool CAPS, with 383 members out of 441 rating the stock outperform, and 58 members rating it underperform. Among 124 CAPS All-Star picks (recommendations by the highest-ranked CAPS members), 106 give Boyd Gaming a green thumbs-up, and 18 give it a red thumbs-down.

Of Wall Street recommendations tracked by S&P Capital IQ, the average opinion on Boyd Gaming is hold, with an average price target of $6.08.

Looking for alternatives to Boyd Gaming? It takes more than great companies to build a fortune for the future. Learn the basic financial habits of millionaires next door and get focused stock ideas in our free report, “3 Stocks That Will Help You Retire Rich.” Click here for instant access to this free report.

The article The Gory Details on Boyd Gaming’s Double Fumble originally appeared on Fool.com.


Seth Jayson had no …read more
Source: FULL ARTICLE at DailyFinance

ABM Industries Beats on Both Top and Bottom Lines

By Seth Jayson, The Motley Fool

Filed under:

ABM Industries (NYS: ABM) reported earnings on March 4. Here are the numbers you need to know.

The 10-second takeaway
For the quarter ended Jan. 31 (Q1), ABM Industries beat slightly on revenues and beat expectations on earnings per share.

Compared to the prior-year quarter, revenue expanded. Non-GAAP earnings per share grew significantly. GAAP earnings per share grew significantly.

Gross margins dropped, operating margins contracted, net margins grew.

Revenue details
ABM Industries recorded revenue of $1.18 billion. The three analysts polled by S&P Capital IQ expected a top line of $1.17 billion on the same basis. GAAP reported sales were 10% higher than the prior-year quarter’s $1.07 billion.

Source: S&P Capital IQ. Quarterly periods. Dollar amounts in millions. Non-GAAP figures may vary to maintain comparability with estimates.

EPS details
EPS came in at $0.26. The five earnings estimates compiled by S&P Capital IQ anticipated $0.22 per share. Non-GAAP EPS of $0.26 for Q1 were 18% higher than the prior-year quarter’s $0.22 per share. GAAP EPS of $0.24 for Q1 were 20% higher than the prior-year quarter’s $0.20 per share.

Source: S&P Capital IQ. Quarterly periods. Non-GAAP figures may vary to maintain comparability with estimates.

Margin details
For the quarter, gross margin was 9.7%, 30 basis points worse than the prior-year quarter. Operating margin was 1.6%, 10 basis points worse than the prior-year quarter. Net margin was 1.1%, 10 basis points better than the prior-year quarter.

Looking ahead
Next quarter’s average estimate for revenue is $1.16 billion. On the bottom line, the average EPS estimate is $0.33.

Next year’s average estimate for revenue is $4.70 billion. The average EPS estimate is $1.37.

Investor sentiment

Of Wall Street recommendations tracked by S&P Capital IQ, the average opinion on ABM Industries is outperform, with an average price target of $24.33.

Looking for alternatives to ABM Industries? It takes more than great companies to build a fortune for the future. Learn the basic financial habits of millionaires next door and get focused stock ideas in our free report, “3 Stocks That Will Help You Retire Rich.” Click here for instant access to this free report.

The article ABM Industries Beats on Both Top and Bottom Lines originally appeared on Fool.com.


Seth Jayson had no position in any company mentioned here at the time of publication. You can view his stock holdings here. He is co-advisor of
Motley Fool Hidden Gems, which provides new small-cap ideas every month, backed by …read more
Source: FULL ARTICLE at DailyFinance

Are You Expecting This from John Bean Technologies?

By Seth Jayson, The Motley Fool

Filed under:

John Bean Technologies (NYS: JBT) is expected to report Q4 earnings on March 6. Here’s what Wall Street wants to see:

The 10-second takeaway
Comparing the upcoming quarter to the prior-year quarter, average analyst estimates predict John Bean Technologies‘s revenues will grow 10.4% and EPS will expand 29.2%.

The average estimate for revenue is $299.8 million. On the bottom line, the average EPS estimate is $0.62.

Revenue details
Last quarter, John Bean Technologies reported revenue of $205.3 million. GAAP reported sales were 11% lower than the prior-year quarter’s $230.3 million.

Source: S&P Capital IQ. Quarterly periods. Dollar amounts in millions. Non-GAAP figures may vary to maintain comparability with estimates.

EPS details
Last quarter, EPS came in at $0.21. GAAP EPS of $0.21 for Q3 were 25% lower than the prior-year quarter’s $0.28 per share.

Source: S&P Capital IQ. Quarterly periods. Non-GAAP figures may vary to maintain comparability with estimates.

Recent performance
For the preceding quarter, gross margin was 25.3%, 50 basis points better than the prior-year quarter. Operating margin was 5.0%, 110 basis points worse than the prior-year quarter. Net margin was 3.0%, 50 basis points worse than the prior-year quarter.

Looking ahead

The full year’s average estimate for revenue is $923.2 million. The average EPS estimate is $1.23.

Investor sentiment
The stock has a four-star rating (out of five) at Motley Fool CAPS, with 101 members out of 104 rating the stock outperform, and three members rating it underperform. Among 42 CAPS All-Star picks (recommendations by the highest-ranked CAPS members), 42 give John Bean Technologies a green thumbs-up, and give it a red thumbs-down.

Of Wall Street recommendations tracked by S&P Capital IQ, the average opinion on John Bean Technologies is outperform, with an average price target of $19.33.

The rich are different than you and me: They might not notice the moneymaking stories right under our noses. In our new report, “Middle-Class Millionaire-Makers: 3 Stocks Wall Street‘s Too Rich to Notice,” we give you three Peter Lynch-inspired buy-what-you-know stocks for the 99%. Click here for instant access to this free report.

The article Are You Expecting This from John Bean Technologies? originally appeared on Fool.com.


Seth Jayson had no position in any company mentioned here at the time of publication. You can view his stock holdings here. He is co-advisor of
Motley Fool Hidden Gems, which provides new small-cap ideas every month, backed by a real-money portfolio. The Motley Fool owns shares of John Bean …read more
Source: FULL ARTICLE at DailyFinance

It's Showtime for Assisted Living Concepts

By Seth Jayson, The Motley Fool

Filed under:

Assisted Living Concepts (NYS: ALC) is expected to report Q4 earnings around March 9. Here’s what Wall Street wants to see:

The 10-second takeaway
Comparing the upcoming quarter to the prior-year quarter, average analyst estimates predict Assisted Living Concepts‘s revenues will decrease -4.6% and EPS will shrink to a loss.

The average estimate for revenue is $56.1 million. On the bottom line, the average EPS estimate is -$0.02.

Revenue details
Last quarter, Assisted Living Concepts booked revenue of $55.6 million. GAAP reported sales were 5.1% lower than the prior-year quarter’s $58.6 million.

Source: S&P Capital IQ. Quarterly periods. Dollar amounts in millions. Non-GAAP figures may vary to maintain comparability with estimates.

EPS details
Last quarter, non-GAAP EPS came in at -$0.04. GAAP EPS were -$0.18 for Q3 against $0.25 per share for the prior-year quarter.

Source: S&P Capital IQ. Quarterly periods. Non-GAAP figures may vary to maintain comparability with estimates.

Recent performance
For the preceding quarter, gross margin was 18.8%, much worse than the prior-year quarter. Operating margin was -1.6%, much worse than the prior-year quarter. Net margin was -7.3%, much worse than the prior-year quarter.

Looking ahead

The full year’s average estimate for revenue is $227.6 million. The average EPS estimate is $0.41.

Investor sentiment
The stock has a two-star rating (out of five) at Motley Fool CAPS, with 129 members out of 139 rating the stock outperform, and 10 members rating it underperform. Among 30 CAPS All-Star picks (recommendations by the highest-ranked CAPS members), 29 give Assisted Living Concepts a green thumbs-up, and one give it a red thumbs-down.

Of Wall Street recommendations tracked by S&P Capital IQ, the average opinion on Assisted Living Concepts is hold, with an average price target of $6.00.

Is Assisted Living Concepts the best health care stock for you? Learn how to maximize your investment income and “Secure Your Future With 9 Rock-Solid Dividend Stocks,” including one above-average health care logistics company. Click here for instant access to this free report.

The article It’s Showtime for Assisted Living Concepts originally appeared on Fool.com.


Seth Jayson had no position in any company mentioned here at the time of publication. You can view his stock holdings here. He is co-advisor of
Motley Fool Hidden Gems, which provides new small-cap ideas every month, backed by a real-money portfolio. The Motley Fool has no position in any of the stocks mentioned. Try any of our Foolish newsletter services free for 30 days. …read more
Source: FULL ARTICLE at DailyFinance

Can WuXi PharmaTech Meet These Numbers?

By Seth Jayson, The Motley Fool

Filed under:

WuXi PharmaTech (NYS: WX) is expected to report Q4 earnings on March 7. Here’s what Wall Street wants to see:

The 10-second takeaway
Comparing the upcoming quarter to the prior-year quarter, average analyst estimates predict WuXi PharmaTech’s revenues will grow 14.2% and EPS will drop 0.0%.

The average estimate for revenue is $124.0 million. On the bottom line, the average EPS estimate is $0.31.

Revenue details
Last quarter, WuXi PharmaTech recorded revenue of $125.8 million. GAAP reported sales were 21% higher than the prior-year quarter’s $104.0 million.

Source: S&P Capital IQ. Quarterly periods. Dollar amounts in millions. Non-GAAP figures may vary to maintain comparability with estimates.

EPS details
Last quarter, non-GAAP EPS came in at $0.36. GAAP EPS of $0.30 for Q3 were 25% higher than the prior-year quarter’s $0.24 per share.

Source: S&P Capital IQ. Quarterly periods. Non-GAAP figures may vary to maintain comparability with estimates.

Recent performance
For the preceding quarter, gross margin was 36.6%, 240 basis points worse than the prior-year quarter. Operating margin was 17.0%, 440 basis points worse than the prior-year quarter. Net margin was 16.9%, 290 basis points worse than the prior-year quarter.

Looking ahead

The full year’s average estimate for revenue is $498.1 million. The average EPS estimate is $1.32.

Investor sentiment
The stock has a four-star rating (out of five) at Motley Fool CAPS, with 322 members out of 342 rating the stock outperform, and 20 members rating it underperform. Among 78 CAPS All-Star picks (recommendations by the highest-ranked CAPS members), 75 give WuXi PharmaTech a green thumbs-up, and three give it a red thumbs-down.

Of Wall Street recommendations tracked by S&P Capital IQ, the average opinion on WuXi PharmaTech is outperform, with an average price target of $18.70.

Looking for alternatives to WuXi PharmaTech? It takes more than great companies to build a fortune for the future. Learn the basic financial habits of millionaires next door and get focused stock ideas in our free report, “3 Stocks That Will Help You Retire Rich.” Click here for instant access to this free report.

The article Can WuXi PharmaTech Meet These Numbers? originally appeared on Fool.com.


Seth Jayson had no position in any company mentioned here at the time of publication. You can view his stock holdings here. He is co-advisor of
Motley Fool Hidden Gems, which provides new small-cap ideas every month, backed by a real-money portfolio. The Motley Fool has no position in any of the stocks mentioned. Try …read more
Source: FULL ARTICLE at DailyFinance

What to Expect from Global Power Equipment Group

By Seth Jayson, The Motley Fool

Filed under:

Global Power Equipment Group (NAS: GLPW) is expected to report Q4 earnings on March 7. Here’s what Wall Street wants to see:

The 10-second takeaway
Comparing the upcoming quarter to the prior-year quarter, average analyst estimates predict Global Power Equipment Group‘s revenues will expand 26.0% and EPS will wither -11.6%.

The average estimate for revenue is $144.9 million. On the bottom line, the average EPS estimate is $0.38.

Revenue details
Last quarter, Global Power Equipment Group reported revenue of $111.5 million. GAAP reported sales were 12% higher than the prior-year quarter’s $99.2 million.

Source: S&P Capital IQ. Quarterly periods. Dollar amounts in millions. Non-GAAP figures may vary to maintain comparability with estimates.

EPS details
Last quarter, non-GAAP EPS came in at $0.13. GAAP EPS of $0.09 for Q3 were 92% lower than the prior-year quarter’s $1.09 per share.

Source: S&P Capital IQ. Quarterly periods. Non-GAAP figures may vary to maintain comparability with estimates.

Recent performance
For the preceding quarter, gross margin was 16.3%, 310 basis points worse than the prior-year quarter. Operating margin was 4.0%, 380 basis points worse than the prior-year quarter. Net margin was 1.4%, much worse than the prior-year quarter.

Looking ahead

The full year’s average estimate for revenue is $455.6 million. The average EPS estimate is $0.60.

Investor sentiment
The stock has a five-star rating (out of five) at Motley Fool CAPS, with 22 members out of 22 rating the stock outperform, and members rating it underperform. Among six CAPS All-Star picks (recommendations by the highest-ranked CAPS members), six give Global Power Equipment Group a green thumbs-up, and give it a red thumbs-down.

Of Wall Street recommendations tracked by S&P Capital IQ, the average opinion on Global Power Equipment Group is outperform, with an average price target of $25.25.

Looking for alternatives to Global Power Equipment Group? It takes more than great companies to build a fortune for the future. Learn the basic financial habits of millionaires next door and get focused stock ideas in our free report, “3 Stocks That Will Help You Retire Rich.” Click here for instant access to this free report.

The article What to Expect from Global Power Equipment Group originally appeared on Fool.com.


Seth Jayson had no position in any company mentioned here at the time of publication. You can view his stock holdings here. He is co-advisor of
Motley Fool Hidden Gems, which provides new small-cap ideas every month, backed by a real-money portfolio. The …read more
Source: FULL ARTICLE at DailyFinance

What to Expect from Williams-Sonoma

By Seth Jayson, The Motley Fool

Filed under:

Williams-Sonoma (NYS: WSM) is expected to report Q4 earnings around March 9. Here’s what Wall Street wants to see:

The 10-second takeaway
Comparing the upcoming quarter to the prior-year quarter, average analyst estimates predict Williams-Sonoma’s revenues will grow 10.2% and EPS will increase 10.3%.

The average estimate for revenue is $1.40 billion. On the bottom line, the average EPS estimate is $1.29.

Revenue details
Last quarter, Williams-Sonoma booked revenue of $944.6 million. GAAP reported sales were 8.9% higher than the prior-year quarter’s $867.2 million.

Source: S&P Capital IQ. Quarterly periods. Dollar amounts in millions. Non-GAAP figures may vary to maintain comparability with estimates.

EPS details
Last quarter, EPS came in at $0.49. GAAP EPS of $0.49 for Q3 were 20% higher than the prior-year quarter’s $0.41 per share.

Source: S&P Capital IQ. Quarterly periods. Non-GAAP figures may vary to maintain comparability with estimates.

Recent performance
For the preceding quarter, gross margin was 52.8%, 10 basis points better than the prior-year quarter. Operating margin was 8.4%, 50 basis points better than the prior-year quarter. Net margin was 5.2%, 20 basis points better than the prior-year quarter.

Looking ahead

The full year’s average estimate for revenue is $4.04 billion. The average EPS estimate is $2.54.

Investor sentiment
The stock has a two-star rating (out of five) at Motley Fool CAPS, with 245 members out of 340 rating the stock outperform, and 95 members rating it underperform. Among 97 CAPS All-Star picks (recommendations by the highest-ranked CAPS members), 81 give Williams-Sonoma a green thumbs-up, and 16 give it a red thumbs-down.

Of Wall Street recommendations tracked by S&P Capital IQ, the average opinion on Williams-Sonoma is outperform, with an average price target of $44.15.

Is Williams-Sonoma the right retailer for your portfolio? Learn how to maximize your investment income and “Secure Your Future With 9 Rock-Solid Dividend Stocks,” including one above-average retailing powerhouse. Click here for instant access to this free report.

The article What to Expect from Williams-Sonoma originally appeared on Fool.com.


Seth Jayson had no position in any company mentioned here at the time of publication. You can view his stock holdings here. He is co-advisor of
Motley Fool Hidden Gems, which provides new small-cap ideas every month, backed by a real-money portfolio. The Motley Fool recommends Williams-Sonoma. Try any of our Foolish newsletter services free for 30 days. We Fools may not all hold the same opinions, but we all believe that considering a diverse range of …read more
Source: FULL ARTICLE at DailyFinance

LHC Group Earnings Are on Deck

By Seth Jayson, The Motley Fool

Filed under:

LHC Group (NAS: LHCG) is expected to report Q4 earnings on March 6. Here’s what Wall Street wants to see:

The 10-second takeaway
Comparing the upcoming quarter to the prior-year quarter, average analyst estimates predict LHC Group’s revenues will grow 2.1% and EPS will decrease -5.1%.

The average estimate for revenue is $160.9 million. On the bottom line, the average EPS estimate is $0.37.

Revenue details
Last quarter, LHC Group reported revenue of $158.9 million. GAAP reported sales were 3.6% higher than the prior-year quarter’s $153.4 million.

Source: S&P Capital IQ. Quarterly periods. Dollar amounts in millions. Non-GAAP figures may vary to maintain comparability with estimates.

EPS details
Last quarter, non-GAAP EPS came in at $0.38. GAAP EPS were $0.36 for Q3 compared to -$2.08 per share for the prior-year quarter.

Source: S&P Capital IQ. Quarterly periods. Non-GAAP figures may vary to maintain comparability with estimates.

Recent performance
For the preceding quarter, gross margin was 42.6%, 20 basis points worse than the prior-year quarter. Operating margin was 7.7%, 140 basis points better than the prior-year quarter. Net margin was 4.0%, much better than the prior-year quarter.

Looking ahead

The full year’s average estimate for revenue is $636.7 million. The average EPS estimate is $1.50.

Investor sentiment
The stock has a five-star rating (out of five) at Motley Fool CAPS, with 224 members out of 233 rating the stock outperform, and nine members rating it underperform. Among 62 CAPS All-Star picks (recommendations by the highest-ranked CAPS members), 59 give LHC Group a green thumbs-up, and three give it a red thumbs-down.

Of Wall Street recommendations tracked by S&P Capital IQ, the average opinion on LHC Group is outperform, with an average price target of $19.07.

Is LHC Group the best health care stock for you? Learn how to maximize your investment income and “Secure Your Future With 9 Rock-Solid Dividend Stocks,” including one above-average health care logistics company. Click here for instant access to this free report.

The article LHC Group Earnings Are on Deck originally appeared on Fool.com.


Seth Jayson had no position in any company mentioned here at the time of publication. You can view his stock holdings here. He is co-advisor of
Motley Fool Hidden Gems, which provides new small-cap ideas every month, backed by a real-money portfolio. The Motley Fool has no position in any of the stocks mentioned. Try any of our Foolish newsletter services free for 30 days. We Fools may not …read more
Source: FULL ARTICLE at DailyFinance

Will Phoenix New Media Beat These Analyst Estimates?

By Seth Jayson, The Motley Fool

Filed under:

Phoenix New Media (NYS: FENG) is expected to report Q4 earnings on March 6. Here’s what Wall Street wants to see:

The 10-second takeaway
Comparing the upcoming quarter to the prior-year quarter, average analyst estimates predict Phoenix New Media‘s revenues will wane -1.0% and EPS will decrease -57.1%.

The average estimate for revenue is $44.0 million. On the bottom line, the average EPS estimate is $0.03.

Revenue details
Last quarter, Phoenix New Media recorded revenue of $45.9 million. GAAP reported sales were 7.4% higher than the prior-year quarter’s $42.4 million.

Source: S&P Capital IQ. Quarterly periods. Dollar amounts in millions. Non-GAAP figures may vary to maintain comparability with estimates.

EPS details
Last quarter, non-GAAP EPS came in at $0.03. GAAP EPS of $0.02 for Q3 were 82% lower than the prior-year quarter’s $0.11 per share.

Source: S&P Capital IQ. Quarterly periods. Non-GAAP figures may vary to maintain comparability with estimates.

Recent performance
For the preceding quarter, gross margin was 44.2%, 540 basis points worse than the prior-year quarter. Operating margin was 1.3%, much worse than the prior-year quarter. Net margin was 4.0%, much worse than the prior-year quarter.

Looking ahead

The full year’s average estimate for revenue is $173.7 million. The average EPS estimate is $0.20.

Investor sentiment
The stock has a one-star rating (out of five) at Motley Fool CAPS, with six members out of 15 rating the stock outperform, and nine members rating it underperform. Among three CAPS All-Star picks (recommendations by the highest-ranked CAPS members), one give Phoenix New Media a green thumbs-up, and two give it a red thumbs-down.

Of Wall Street recommendations tracked by S&P Capital IQ, the average opinion on Phoenix New Media is outperform, with an average price target of $5.28.

Internet software and services are being consumed in radically different ways, on new and increasingly mobile devices. Is Phoenix New Media on the right side of the revolution? Check out the changing landscape and meet the company that Motley Fool analysts expect to lead “The Next Trillion-dollar Revolution.” Click here for instant access to this free report.

The article Will Phoenix New Media Beat These Analyst Estimates? originally appeared on Fool.com.


Seth Jayson had no position in any company mentioned here at the time of publication. You can view his stock holdings here. He is co-advisor of
Motley Fool Hidden Gems, which provides new small-cap ideas every month, backed by a real-money portfolio. The Motley Fool has no position …read more
Source: FULL ARTICLE at DailyFinance

Chesapeake Utilities Earnings Are on Deck

By Seth Jayson, The Motley Fool

Filed under:

Chesapeake Utilities (NYS: CPK) is expected to report Q4 earnings on March 7. Here’s what Wall Street wants to see:

The 10-second takeaway
Comparing the upcoming quarter to the prior-year quarter, average analyst estimates predict Chesapeake Utilities‘s revenues will grow 4.2% and EPS will grow 14.7%.

The average estimate for revenue is $108.3 million. On the bottom line, the average EPS estimate is $0.86.

Revenue details
Last quarter, Chesapeake Utilities reported revenue of $78.2 million. GAAP reported sales were 3.0% lower than the prior-year quarter’s $80.6 million.

Source: S&P Capital IQ. Quarterly periods. Dollar amounts in millions. Non-GAAP figures may vary to maintain comparability with estimates.

EPS details
Last quarter, EPS came in at $0.33. GAAP EPS of $0.33 for Q3 were 32% higher than the prior-year quarter’s $0.25 per share.

Source: S&P Capital IQ. Quarterly periods. Non-GAAP figures may vary to maintain comparability with estimates.

Recent performance
For the preceding quarter, gross margin was 20.3%, 430 basis points better than the prior-year quarter. Operating margin was 9.7%, 280 basis points better than the prior-year quarter. Net margin was 4.1%, 110 basis points better than the prior-year quarter.

Looking ahead

The full year’s average estimate for revenue is $391.8 million. The average EPS estimate is $2.83.

Investor sentiment
The stock has a four-star rating (out of five) at Motley Fool CAPS, with 97 members out of 106 rating the stock outperform, and nine members rating it underperform. Among 27 CAPS All-Star picks (recommendations by the highest-ranked CAPS members), 27 give Chesapeake Utilities a green thumbs-up, and give it a red thumbs-down.

Of Wall Street recommendations tracked by S&P Capital IQ, the average opinion on Chesapeake Utilities is buy, with an average price target of $48.33.

Can your portfolio provide you with enough income to last through retirement? You’ll need more than Chesapeake Utilities. Learn how to maximize your investment income and “Secure Your Future With 9 Rock-Solid Dividend Stocks.” Click here for instant access to this free report.

The article Chesapeake Utilities Earnings Are on Deck originally appeared on Fool.com.


Seth Jayson had no position in any company mentioned here at the time of publication. You can view his stock holdings here. He is co-advisor of
Motley Fool Hidden Gems, which provides new small-cap ideas every month, backed by a real-money portfolio. The Motley Fool has no position in any of the stocks mentioned. Try any of our Foolish newsletter services free for 30 days. We Fools …read more
Source: FULL ARTICLE at DailyFinance

Does The Street Have Quiksilver Figured Out?

By Seth Jayson, The Motley Fool

Filed under:

Quiksilver (NYS: ZQK) is expected to report Q1 earnings on March 7. Here’s what Wall Street wants to see:

The 10-second takeaway
Comparing the upcoming quarter to the prior-year quarter, average analyst estimates predict Quiksilver’s revenues will expand 3.4% and EPS will remain in the red.

The average estimate for revenue is $464.9 million. On the bottom line, the average EPS estimate is -$0.07.

Revenue details
Last quarter, Quiksilver booked revenue of $559.0 million. GAAP reported sales were 2.5% higher than the prior-year quarter’s $545.2 million.

Source: S&P Capital IQ. Quarterly periods. Dollar amounts in millions. Non-GAAP figures may vary to maintain comparability with estimates.

EPS details
Last quarter, non-GAAP EPS came in at $0.07. GAAP EPS of $0.02 for Q4 were 95% lower than the prior-year quarter’s $0.38 per share.

Source: S&P Capital IQ. Quarterly periods. Non-GAAP figures may vary to maintain comparability with estimates.

Recent performance
For the preceding quarter, gross margin was 45.9%, 600 basis points worse than the prior-year quarter. Operating margin was 3.7%, 280 basis points worse than the prior-year quarter. Net margin was 0.8%, much worse than the prior-year quarter.

Looking ahead

The full year’s average estimate for revenue is $2.11 billion. The average EPS estimate is $0.19.

Investor sentiment
The stock has a three-star rating (out of five) at Motley Fool CAPS, with 252 members out of 291 rating the stock outperform, and 39 members rating it underperform. Among 80 CAPS All-Star picks (recommendations by the highest-ranked CAPS members), 69 give Quiksilver a green thumbs-up, and 11 give it a red thumbs-down.

Of Wall Street recommendations tracked by S&P Capital IQ, the average opinion on Quiksilver is outperform, with an average price target of $4.48.

Selling to fickle consumers is a tough business for Quiksilver or anyone else in the space. But some companies are better equipped to face the future than others. In a new report, we’ll give you the rundown on three companies that are setting themselves up to dominate retail. Click here for instant access to this free report.

The article Does The Street Have Quiksilver Figured Out? originally appeared on Fool.com.


Seth Jayson had no position in any company mentioned here at the time of publication. You can view his stock holdings here. He is co-advisor of
Motley Fool Hidden Gems, which provides new small-cap ideas every month, backed by a real-money portfolio. The Motley Fool has no position in any of the stocks mentioned. Try any of …read more
Source: FULL ARTICLE at DailyFinance

It's Showtime for Delek US Holdings

By Seth Jayson, The Motley Fool

Filed under:

Delek US Holdings (NYS: DK) is expected to report Q4 earnings on March 6. Here’s what Wall Street wants to see:

The 10-second takeaway
Comparing the upcoming quarter to the prior-year quarter, average analyst estimates predict Delek US Holdings’s revenues will wane -4.9% and EPS will turn positive

The average estimate for revenue is $1.90 billion. On the bottom line, the average EPS estimate is $1.01.

Revenue details
Last quarter, Delek US Holdings logged revenue of $2.24 billion. GAAP reported sales were 1.5% higher than the prior-year quarter’s $2.21 billion.

Source: S&P Capital IQ. Quarterly periods. Dollar amounts in millions. Non-GAAP figures may vary to maintain comparability with estimates.

EPS details
Last quarter, EPS came in at $1.67. GAAP EPS of $1.67 for Q3 were 14% higher than the prior-year quarter’s $1.46 per share.

Source: S&P Capital IQ. Quarterly periods. Non-GAAP figures may vary to maintain comparability with estimates.

Recent performance
For the preceding quarter, gross margin was 13.5%, 70 basis points better than the prior-year quarter. Operating margin was 7.4%, 70 basis points better than the prior-year quarter. Net margin was 4.5%, 60 basis points better than the prior-year quarter.

Looking ahead

The full year’s average estimate for revenue is $7.90 billion. The average EPS estimate is $4.62.

Investor sentiment
The stock has a three-star rating (out of five) at Motley Fool CAPS, with 316 members out of 341 rating the stock outperform, and 25 members rating it underperform. Among 95 CAPS All-Star picks (recommendations by the highest-ranked CAPS members), 88 give Delek US Holdings a green thumbs-up, and seven give it a red thumbs-down.

Of Wall Street recommendations tracked by S&P Capital IQ, the average opinion on Delek US Holdings is outperform, with an average price target of $30.00.

Is Delek US Holdings the right energy stock for you? Read about a handful of timely, profit-producing plays on expensive crude in “3 Stocks for $100 Oil.” Click here for instant access to this free report.

The article It’s Showtime for Delek US Holdings originally appeared on Fool.com.


Seth Jayson had no position in any company mentioned here at the time of publication. You can view his stock holdings here. He is co-advisor of
Motley Fool Hidden Gems, which provides new small-cap ideas every month, backed by a real-money portfolio. The Motley Fool has no position in any of the stocks mentioned. Try any of our Foolish newsletter services free for 30 days. We Fools …read more
Source: FULL ARTICLE at DailyFinance

EPL Oil & Gas's Upcoming Earnings: What You Need To Know

By Seth Jayson, The Motley Fool

Filed under:

EPL Oil & Gas (NYS: EPL) is expected to report Q4 earnings on March 7. Here’s what Wall Street wants to see:

The 10-second takeaway
Comparing the upcoming quarter to the prior-year quarter, average analyst estimates predict EPL Oil & Gas’s revenues will increase 32.2% and EPS will grow 23.7%.

The average estimate for revenue is $136.6 million. On the bottom line, the average EPS estimate is $0.47.

Revenue details
Last quarter, EPL Oil & Gas recorded revenue of $86.7 million. GAAP reported sales were 2.1% higher than the prior-year quarter’s $84.9 million.

Source: S&P Capital IQ. Quarterly periods. Dollar amounts in millions. Non-GAAP figures may vary to maintain comparability with estimates.

EPS details
Last quarter, non-GAAP EPS came in at $0.31. GAAP EPS were -$0.06 for Q3 versus $0.58 per share for the prior-year quarter.

Source: S&P Capital IQ. Quarterly periods. Non-GAAP figures may vary to maintain comparability with estimates.

Recent performance
For the preceding quarter, gross margin was 71.0%, 620 basis points worse than the prior-year quarter. Operating margin was -3.3%, much worse than the prior-year quarter. Net margin was -2.6%, much worse than the prior-year quarter.

Looking ahead

The full year’s average estimate for revenue is $419.8 million. The average EPS estimate is $1.63.

Investor sentiment
The stock has a four-star rating (out of five) at Motley Fool CAPS, with 146 members out of 156 rating the stock outperform, and 10 members rating it underperform. Among 37 CAPS All-Star picks (recommendations by the highest-ranked CAPS members), 33 give EPL Oil & Gas a green thumbs-up, and four give it a red thumbs-down.

Of Wall Street recommendations tracked by S&P Capital IQ, the average opinion on EPL Oil & Gas is buy, with an average price target of $26.25.

Is EPL Oil & Gas the right energy stock for you? Read about a handful of timely, profit-producing plays on expensive crude in “3 Stocks for $100 Oil.” Click here for instant access to this free report.

The article EPL Oil & Gas’s Upcoming Earnings: What You Need To Know originally appeared on Fool.com.


Seth Jayson had no position in any company mentioned here at the time of publication. You can view his stock holdings here. He is co-advisor of
Motley Fool Hidden Gems, which provides new small-cap ideas every month, backed by a real-money portfolio. The Motley Fool has no position in any of the stocks mentioned. Try any of our Foolish newsletter services …read more
Source: FULL ARTICLE at DailyFinance

What Does Wall Street See for Semtech's Q4?

By Seth Jayson, The Motley Fool

Filed under:

Semtech (NAS: SMTC) is expected to report Q4 earnings on March 6. Here’s what Wall Street wants to see:

The 10-second takeaway
Comparing the upcoming quarter to the prior-year quarter, average analyst estimates predict Semtech’s revenues will grow 43.3% and EPS will expand 34.4%.

The average estimate for revenue is $149.1 million. On the bottom line, the average EPS estimate is $0.43.

Revenue details
Last quarter, Semtech booked revenue of $160.9 million. GAAP reported sales were 30% higher than the prior-year quarter’s $123.9 million.

Source: S&P Capital IQ. Quarterly periods. Dollar amounts in millions. Non-GAAP figures may vary to maintain comparability with estimates.

EPS details
Last quarter, non-GAAP EPS came in at $0.53. GAAP EPS of $0.25 for Q3 were 38% lower than the prior-year quarter’s $0.40 per share.

Source: S&P Capital IQ. Quarterly periods. Non-GAAP figures may vary to maintain comparability with estimates.

Recent performance
For the preceding quarter, gross margin was 62.9%, 370 basis points better than the prior-year quarter. Operating margin was 15.8%, 290 basis points worse than the prior-year quarter. Net margin was 10.3%, much worse than the prior-year quarter.

Looking ahead

The full year’s average estimate for revenue is $577.4 million. The average EPS estimate is $1.64.

Investor sentiment
The stock has a three-star rating (out of five) at Motley Fool CAPS, with 92 members out of 103 rating the stock outperform, and 11 members rating it underperform. Among 36 CAPS All-Star picks (recommendations by the highest-ranked CAPS members), 34 give Semtech a green thumbs-up, and two give it a red thumbs-down.

Of Wall Street recommendations tracked by S&P Capital IQ, the average opinion on Semtech is buy, with an average price target of $32.00.

Is Semtech the best semiconductor stock for you? You may be missing something obvious. Check out the semiconductor company that Motley Fool analysts expect to lead “The Next Trillion-dollar Revolution.” Click here for instant access to this free report.

The article What Does Wall Street See for Semtech’s Q4? originally appeared on Fool.com.


Seth Jayson had no position in any company mentioned here at the time of publication. You can view his stock holdings here. He is co-advisor of
Motley Fool Hidden Gems, which provides new small-cap ideas every month, backed by a real-money portfolio. The Motley Fool has no position in any of the stocks mentioned. Try any of our Foolish newsletter services free for 30 days. We Fools may not all hold the same opinions, but …read more
Source: FULL ARTICLE at DailyFinance

What to Expect from General Communication

By Seth Jayson, The Motley Fool

Filed under:

General Communication (NAS: GNCMA) is expected to report Q4 earnings on March 6. Here’s what Wall Street wants to see:

The 10-second takeaway
Comparing the upcoming quarter to the prior-year quarter, average analyst estimates predict General Communication‘s revenues will increase 5.2% and EPS will turn positive

The average estimate for revenue is $177.6 million. On the bottom line, the average EPS estimate is $0.09.

Revenue details
Last quarter, General Communication booked revenue of $178.5 million. GAAP reported sales were 0.4% higher than the prior-year quarter’s $177.7 million.

Source: S&P Capital IQ. Quarterly periods. Dollar amounts in millions. Non-GAAP figures may vary to maintain comparability with estimates.

EPS details
Last quarter, EPS came in at $0.09. GAAP EPS of $0.09 for Q3 were 40% lower than the prior-year quarter’s $0.15 per share.

Source: S&P Capital IQ. Quarterly periods. Non-GAAP figures may vary to maintain comparability with estimates.

Recent performance
For the preceding quarter, gross margin was 64.8%, 110 basis points worse than the prior-year quarter. Operating margin was 14.2%, 380 basis points worse than the prior-year quarter. Net margin was 2.1%, 200 basis points worse than the prior-year quarter.

Looking ahead

The full year’s average estimate for revenue is $704.3 million. The average EPS estimate is $0.30.

Investor sentiment
The stock has a two-star rating (out of five) at Motley Fool CAPS, with 30 members out of 52 rating the stock outperform, and 22 members rating it underperform. Among 12 CAPS All-Star picks (recommendations by the highest-ranked CAPS members), six give General Communication a green thumbs-up, and six give it a red thumbs-down.

Of Wall Street recommendations tracked by S&P Capital IQ, the average opinion on General Communication is buy, with an average price target of $12.67.

Looking for alternatives to General Communication? It takes more than great companies to build a fortune for the future. Learn the basic financial habits of millionaires next door and get focused stock ideas in our free report, “3 Stocks That Will Help You Retire Rich.” Click here for instant access to this free report.

The article What to Expect from General Communication originally appeared on Fool.com.


Seth Jayson had no position in any company mentioned here at the time of publication. You can view his stock holdings here. He is co-advisor of
Motley Fool Hidden Gems, which provides new small-cap ideas every month, backed by a real-money portfolio. The Motley Fool has no position in any of the stocks mentioned. Try any …read more
Source: FULL ARTICLE at DailyFinance

Canadian Natural Resources, in the Spotlight Soon

By Seth Jayson, The Motley Fool

Canadian Natural Resources (TSX: CNQ) is expected to report Q4 earnings on March 7. Here’s what Wall Street wants to see:

The 10-second takeaway
Comparing the upcoming quarter to the prior-year quarter, average analyst estimates predict Canadian Natural Resources‘s revenues will wane -14.9% and EPS will shrink -55.2%.

The average estimate for revenue is $3.53 billion. On the bottom line, the average EPS estimate is $0.39.

Revenue details
Last quarter, Canadian Natural Resources tallied revenue of $3.59 billion. GAAP reported sales were 13% higher than the prior-year quarter’s $3.17 billion.

Source: S&P Capital IQ. Quarterly periods. Dollar amounts in millions. Non-GAAP figures may vary to maintain comparability with estimates.

EPS details
Last quarter, non-GAAP EPS came in at $0.32. GAAP EPS of $0.33 for Q3 were 55% lower than the prior-year quarter’s $0.73 per share.

Source: S&P Capital IQ. Quarterly periods. Non-GAAP figures may vary to maintain comparability with estimates.

Recent performance
For the preceding quarter, gross margin was 52.6%, 430 basis points worse than the prior-year quarter. Operating margin was 16.3%, much worse than the prior-year quarter. Net margin was 10.2%, much worse than the prior-year quarter.

Looking ahead

The full year’s average estimate for revenue is $14.98 billion. The average EPS estimate is $1.64.

Investor sentiment
The stock has a five-star rating (out of five) at Motley Fool CAPS, with 1,484 members out of 1,514 rating the stock outperform, and 30 members rating it underperform. Among 335 CAPS All-Star picks (recommendations by the highest-ranked CAPS members), 332 give Canadian Natural Resources a green thumbs-up, and three give it a red thumbs-down.

Of Wall Street recommendations tracked by S&P Capital IQ, the average opinion on Canadian Natural Resources is outperform, with an average price target of $41.75.

Is Canadian Natural Resources the right energy stock for you? Read about a handful of timely, profit-producing plays on expensive crude in “3 Stocks for $100 Oil.” Click here for instant access to this free report.

The article Canadian Natural Resources, in the Spotlight Soon originally appeared on Fool.com.


Seth Jayson had no position in any company mentioned here at the time of publication. You can view his stock holdings here. He is co-advisor of
Motley Fool Hidden Gems, which provides new small-cap ideas every month, backed by a real-money portfolio. The Motley Fool has no position in any of the stocks mentioned. Try any of our Foolish newsletter services free for 30 days. We Fools may not all hold the same opinions, but we all believe that <a target=_blank …read more
Source: FULL ARTICLE at DailyFinance

It's Showtime for Pacira Pharmaceuticals

By Seth Jayson, The Motley Fool

Filed under:

Pacira Pharmaceuticals (NAS: PCRX) is expected to report Q4 earnings on March 7. Here’s what Wall Street wants to see:

The 10-second takeaway
Comparing the upcoming quarter to the prior-year quarter, average analyst estimates predict Pacira Pharmaceuticals‘s revenues will grow 132.3% and EPS will remain in the red.

The average estimate for revenue is $9.8 million. On the bottom line, the average EPS estimate is -$0.42.

Revenue details
Last quarter, Pacira Pharmaceuticals tallied revenue of $8.5 million. GAAP reported sales were much higher than the prior-year quarter’s $4.0 million.

Source: S&P Capital IQ. Quarterly periods. Dollar amounts in millions. Non-GAAP figures may vary to maintain comparability with estimates.

EPS details
Last quarter, EPS came in at -$0.49. GAAP EPS were -$0.49 for Q3 compared to -$0.55 per share for the prior-year quarter.

Source: S&P Capital IQ. Quarterly periods. Non-GAAP figures may vary to maintain comparability with estimates.

Recent performance
For the preceding quarter, gross margin was -9.4%, much worse than the prior-year quarter. Operating margin was -185.1%, much better than the prior-year quarter. Net margin was -185.5%, much better than the prior-year quarter.

Looking ahead

The full year’s average estimate for revenue is $38.4 million. The average EPS estimate is -$1.63.

Investor sentiment
The stock has a one-star rating (out of five) at Motley Fool CAPS, with 20 members out of 30 rating the stock outperform, and 10 members rating it underperform. Among 11 CAPS All-Star picks (recommendations by the highest-ranked CAPS members), six give Pacira Pharmaceuticals a green thumbs-up, and five give it a red thumbs-down.

Of Wall Street recommendations tracked by S&P Capital IQ, the average opinion on Pacira Pharmaceuticals is buy, with an average price target of $21.20.

The article It’s Showtime for Pacira Pharmaceuticals originally appeared on Fool.com.


Seth Jayson had no position in any company mentioned here at the time of publication. You can view his stock holdings here. He is co-advisor of
Motley Fool Hidden Gems, which provides new small-cap ideas every month, backed by a real-money portfolio. The Motley Fool has no position in any of the stocks mentioned. Try any of our Foolish newsletter services free for 30 days. We Fools may not all hold the same opinions, but we all believe that considering a diverse range of insights makes us better investors. The Motley Fool has a disclosure policy.

Copyright © 1995 – 2013 The Motley Fool, LLC. All rights reserved. The Motley Fool has a …read more
Source: FULL ARTICLE at DailyFinance