By Seth Jayson, The Motley Fool
Filed under: Investing
PNM Resources (NYS: PNM) reported earnings on March 1. Here are the numbers you need to know.
The 10-second takeaway
For the quarter ended Dec. 31 (Q4), PNM Resources missed estimates on revenues and beat expectations on earnings per share.
Compared to the prior-year quarter, revenue shrank. Non-GAAP earnings per share shrank significantly. GAAP earnings per share dropped significantly.
Margins shrank across the board.
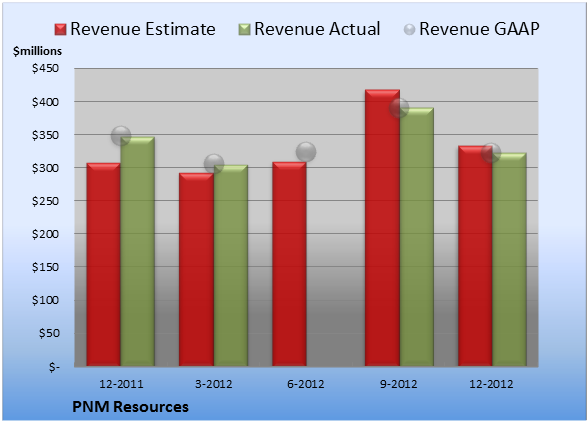
Revenue details
PNM Resources tallied revenue of $322.8 million. The two analysts polled by S&P Capital IQ expected revenue of $333.5 million on the same basis. GAAP reported sales were 7.2% lower than the prior-year quarter’s $347.9 million.
Source: S&P Capital IQ. Quarterly periods. Dollar amounts in millions. Non-GAAP figures may vary to maintain comparability with estimates.
EPS details
EPS came in at $0.13. The seven earnings estimates compiled by S&P Capital IQ predicted $0.12 per share. Non-GAAP EPS of $0.13 for Q4 were 41% lower than the prior-year quarter’s $0.22 per share. GAAP EPS of $0.11 for Q4 were 92% lower than the prior-year quarter’s $1.34 per share.
Source: S&P Capital IQ. Quarterly periods. Non-GAAP figures may vary to maintain comparability with estimates.
Margin details
For the quarter, gross margin was 45.3%, 520 basis points worse than the prior-year quarter. Operating margin was 10.6%, 780 basis points worse than the prior-year quarter. Net margin was 2.7%, much worse than the prior-year quarter.
Looking ahead
Next quarter’s average estimate for revenue is $326.0 million. On the bottom line, the average EPS estimate is $0.20.
Next year’s average estimate for revenue is $1.38 billion. The average EPS estimate is $1.38.
Investor sentiment
The stock has a four-star rating (out of five) at Motley Fool CAPS, with 108 members out of 122 rating the stock outperform, and 14 members rating it underperform. Among 39 CAPS All-Star picks (recommendations by the highest-ranked CAPS members), 36 give PNM Resources a green thumbs-up, and three give it a red thumbs-down.
Of Wall Street recommendations tracked by S&P Capital IQ, the average opinion on PNM Resources is hold, with an average price target of $21.83.
Can your portfolio provide you with enough income to last through retirement? You’ll need more than PNM Resources. Learn how to maximize your investment income and “Secure Your Future With 9 Rock-Solid Dividend Stocks.” Click here for instant access to this free report.
- Add PNM Resources to My Watchlist.
The article PNM Resources Beats Estimates But Has a Big Earnings Drop originally appeared on Fool.com.
Seth Jayson had no …read more
Source: FULL ARTICLE at DailyFinance