Tag Archives: VIX

Earnings Season Looms With Alcoa on Deck

By Doug Ehrman, The Motley Fool

Filed under:

Alcoa has long marked the unofficial kickoff of the earnings season as the first Dow component to report each quarter. The company is scheduled to release numbers tomorrow, and it may well set the tone for the materials sector, the index, and the overall market. In the broader market, a Bloomberg survey suggests that earnings for S&P 500 companies are expected to contract for the first time since 2009. Alcoa has some strong fundamental metrics heading into the release, but with weak sentiment for the market, and specifically for aluminum prices, caution is warranted.

The market backdrop
Johanna Bennett of Barron’s recently explained the role of the upcoming earnings season on the overall tenor of the market, and the tone that Alcoa may set:

Many strategists argue that as a stock market catalyst, earnings have taken a back seat to the accommodative Federal Reserve. But eventually, earnings will resume their role as the engine driving the stock market. And that engine needs some gas.

This remark comes even as Monsanto beat on both the top and bottom lines and upped its outlook for the year; the company reported earnings of $2.73 per share against expectations of $2.58. Furthermore, the company’s heightened expectations, if met, would mark the third consecutive year in which the seed giant achieves growth above 20%. In the shadow of such a report, you can see how important Alcoa can be as an indicator.

Alcoa’s expected results
Heading into Monday’s release, the consensus EPS for Alcoa looks to be $0.11 on revenues of $5.97 billion. Referring back to the company’s most recent earnings release, we see that Alcoa is expecting solid earnings growth for 2013 in the range of 9% to 10%. The bulk of this growth is driven by China, which recently saw a 4.5% increase in the construction sub-index of Chinese PMI. That’s is a carry-through of the $150 billion in government-approved expansion projects to combat slowing GDP growth.

China is of particular importance, given that Alcoa’s own projections have it accounting for 23% of global consumption. Chinese demand will, therefore, be of particular significance and may serve as a critical indicator for investors. Any dramatic shifts in government policy relating to those critical expansion projects should be seen as a central risk factor or price driver.

Outlook and risk factors
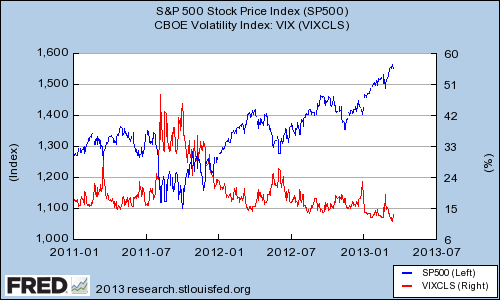
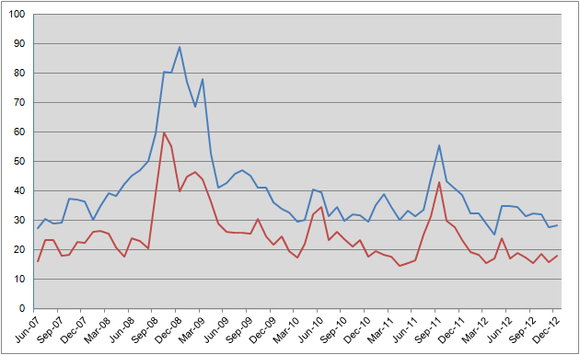
While the company specifics are certainly of importance, drivers of the broad market may have a greater short-term impact on the stock. Earlier this week, the VIX — the market‘s unofficial fear index — jumped 11%; year-to-date the VIX is down roughly 21%. As the Dow continues to dance with new record highs, a significant market correction is likely to be the most significant risk factor at present.

You should also pay careful attention to the company’s guidance. Not only will this affect the stock, but it could also have an impact on the market as a whole. …read more

Source: FULL ARTICLE at DailyFinance

These 3 Energy Stocks Trounced the Market Today

By Dan Dzombak, The Motley Fool

Filed under:

Markets and energy prices were on the move today as fear rose over the economy after a weaker-than-expected private-sector jobs report. At 5:00 pm ET on Wednesday, the VIX was up 11.19%, Brent crude was down 3.04% to $107.32, and WTI crude was down 2.71% to $94.53. U.S. natural gas was up 1.61% to $3.90.

Today’s energy-stock leaders
Among U.S. companies with market caps greater than $500 million, today’s energy-stocks leader was Magnum Hunter Resources , up 3.15% to $3.93. Magnum was up more than 10% this morning, after the company announced an asset sale of its Eagle Ford Shale assets to Penn Virginia for $401 million. The assets include 19,000 net acres with 49 producing wells, seven wells drilled, and four currently being drilled. For March, the average daily production was 3,000 barrels of oil equivalent per day. Magnum plans on using the cash from the sale to pay down debt, which as of Sept. 30 stood at $680 million. The company is late in reporting its annual result for the year ended Dec. 31, after it identified material weaknesses in its internal controls. Investors should be wary of investing in a company that’s late in filing.

Second among energy stocks today was Arch Coal up 2.42% to $5.08, while in third was Peabody Energy , up 1.15% to $20.15. Coal stocks been crushed as environmental regulations pushed up the price of running coal plants and cheap natural gas provided an easy and cheaper alternative for power producers. Natural gas has taken significant market share in the U.S. power markets, and coal demand and prices have fallen as a result.

Weaker companies haven’t survived, with Patriot Coal, for one, going into bankruptcy. The company was spun off from Peabody Energy in 2007 and has been weighed down by $1.6 billion in retiree health benefits. As part of the spinoff, Peabody agreed to cover certain health-care costs for former Peabody employees. Patriot is suing Peabody to make sure that Peabody “does not attempt to use Patriot’s bankruptcy to escape Peabody’s own health care obligations to certain retirees.” Peabody argues that if Patriot’s obligations are lessened; then its own obligations are also lessened. Yesterday, Patriot asked the bankruptcy court to cap life insurance benefits and health-care coverage for its retirees. The company has 4,000 employees and 8,100 retirees.

Foolish bottom line
The coal industry in the United States has been in a state of flux since the arrival of a cheaper alternative for energy production: natural gas. Exports are becoming a much bigger part of the domestic coal landscape, and Peabody Energy has deals in place to get its cheaper coal from the Powder River and Illinois basins to India, China, and the EU. For investors looking to capitalize on a rebound in the U.S. coal market, The Motley Fool has authored a special new premium report detailing exactly why Peabody Energy is perhaps …read more
Source: FULL ARTICLE at DailyFinance

Why the Dow Has Plunged More Than 100 Points

By Dan Carroll, The Motley Fool

Filed under:

Forget about yesterday’s great gains. The markets are embracing the red today, and as of 2:30 p.m. EDT the Dow Jones Industrial Average has plunged 102 points, or 0.7%, easily giving up everything it gained yesterday. Most stocks on the blue-chip index are in the red, with several recording significant losses. Today’s drop doesn’t owe to recent events so much as it owes to what investors are feeling. Let’s catch up on why the market’s so far in the red.

Investors catch a case of the jitters
The bad news started early as payroll-processing company ADP reported that private-sector hiring dried up last month. The addition of 158,000 jobs added last month was far short of expectations for nearly 200,000 and fell significantly from February’s hiring pace. The decline in private-sector hiring isn’t likely responsible for all of today’s market drop, however. With the record highs the markets have been hitting, cautious investors wary of a pullback are much more likely to react negatively to news such as this — and thus create opportunities for investors looking for a dip in their favorite stocks.

That caution is evidenced by today’s 9%-plus jump in the market’s CBOE Volatility Index , or VIX — the measure of fear in the markets. So long as the markets remain at these highs despite the economy’s sluggish growth, expect more volatile days like this from both the Vix and the major indexes.

On the stock front, a few picks are making the most of a bad day. Boeing shares are up 0.7% to rank among the few winners on the Dow. Japanese carrier All Nippon Airways is reportedly sending its pilots back into flight simulator training for Boeing’s grounded 787 Dreamliner aircraft after Boeing finished more than half of the necessary tests on its new battery fix. The resumption of training is a vote of confidence that the company will have the 787 ready to fly again in the near future — something investors have been patiently waiting for.

Unfortunately, most stocks aren’t gaining ground today. Big banks are leading the charge into the red: Bank of America has lost 3.5%, and JPMorgan is down 2.8%. Bank stocks have done well over the course of the recovery, but today’s investor pullback is hitting the financial sector harder than the rest today.

Although there’s no news important enough to justify today’s drop, it’s natural to expect jittery investors to retreat from this sector on negative economic news. Still, over the long term, the recovery should benefit stocks like B of A and JP Morgan: While dips are expected, these two stocks have rewarded investors handsomely recently.

Is B of A a buy?
Bank of America’s stock doubled in 2012. Is there more yet to come? With significant challenges still ahead, it’s critical to have a solid understanding of this megabank before adding it to your portfolio. In The Motley Fool’s premium research report …read more
Source: FULL ARTICLE at DailyFinance

Readers Respond: The 10 Best Ways to Play the Hugest Bubble in History

By Ilan Moscovitz and John Reeves, The Motley Fool

Filed under:

WHat??????????
What is the hell are you guys talking about ??????????

That was just one of the nearly 1,700 emails we received in response to our “Hugest Bubble in History Set to Explode” special alert.

By now, most of you probably know that we weren’t really tipped off to a soon-to-explode bubble of historic proportions. There was no anonymous Swiss bubble expert feeding us information — it was all part of this year’s April Fool’s Day joke, which took to task Wall Street, hurried speculators, and breathless pundits.

In addition to offering our own Market Goggles™ to help you “see” through the market noise and a ShadowFear Index™ that identified “hidden” levels of market fear, we asked readers to submit their own favorite bubble plays.

The most popular were big-name blue chips: Johnson & Johnson, Hormel, Berkshire Hathaway, and Costco. A lot of readers also thought tech stocks like Apple and 3D Systems would be good picks for a bubble.

Commodity buffs liked natural gas exporter Cheniere Energy and Silver Wheaton. The VIX market volatility index was also a popular pick, even though we claimed in update 7 that the VIX IS CONTROLLED BY WALL STREET.

Here were some fairly typical responses:

I want two (2) pairs [of Market Goggles™].
I want green and blue
One stock I am interested in to play the bubble is Johnson & Johnson (JNJ).

Is this a joke? JNJ

Please send me the “MegaBubble: What’s Hot and What’s Not” special free report.

Wondering if you still have the market Google for free. 

Some readers got really creative and suggested alternative investments for playing the bubble. Here are 10 of our favorite responses:

1. As an asset class, ant farms have held their value in previous market downturns. The only downside that I can foresee is that it is a niche market within the collectibles class that is very thinly traded, and is only traded on the Puerto Maldonaldo exchange.

2. With the end of Hostess, Twinkies are already becoming a rare commodity…. The already low supply and intense demand that will come after the collapse will create a perfect storm for Twinkie prices.

3. Invest heavily in toilet paper…….and shovels……

4. None of the metals you mentioned above. More likely silver. Secondarily maybe Boron.

5. I would like to request one pair of 3-D glasses, Rose colored lenses; my stock to play the bubble is Facebook.

6. Cannot reveal source as it is a close and trusted friend, seems [large European bank] is looking more and more “troubling.”

[At that point, our reader received our automatic email response: “Dear Fool, Thanks for your note! The Motley Fool’s mission is “to educate, amuse, and enrich,” and every April 1, we like to focus on amusement in particular….” The reader then replied]

Oh, then “nevermind” the bit on [large European bank]
Onwards

7. Hardened Structures, LLC and Utah Shelter Systems. Should the dreaded triple top scenario play out, global markets will be worthless so we should invest …read more
Source: FULL ARTICLE at DailyFinance

What Buffett Didn't Say About Goldman

By Alex Dumortier, CFA, The Motley Fool

Filed under:

The ceiling is holding fast. The market pared its losses from earlier in the day, with the S&P 500 and the narrower, price-weighted Dow Jones Industrial Average finishing down 0.1% and 0.2%, respectively. For the S&P 500, this is the 12th time this month the index has closed within 1% of its October 2007 high, and that number appears to defy chance.

Consistent with stocks’ decline, option traders pushed the VIX , Wall Street‘s “fear index,” up 3% to close above 13. (The VIX is calculated from S&P 500 option prices and reflects investor expectations for stock market volatility over the coming 30 days.)

The bottom line on Buffett’s new deal terms
In this morning’s column, I mentioned that Berkshire Hathaway CEO Warren Buffett had renegotiated the terms of his warrants on shares of investment bank Goldman Sachs and highlighted the 50-year relationship between Buffett and Goldman. Here, I’d like to focus on the new terms and why current or prospective Goldman shareholders should be paying attention.

The warrants Goldman initially granted to Berkshire gave Buffett the right to purchase 43.5 million shares of its shares at a strike price of $115, which would require a $5 billion cash payment and hand Berkshire roughly a 9% stake. Instead, Buffett will receive a share award roughly equivalent in value to the immediate capital gains on 43.5 million shares bought at $115 (strictly speaking, it will equal the difference in value between the average closing price on the 10 days before Oct. 1 and $115, multiplied by $43.5 million.)

Crucially, the new terms require no cash disbursement by Buffett — it’s pure manna from Goldman. Conversely, Berkshire will be left with a much smaller stake in the bank — around 2%, based on Monday’s closing price. In announcing the new terms, Buffett said:

“We intend to hold a significant investment in Goldman Sachs, a firm that I did my first transaction with more than 50 years ago. I have been privileged to have known and admired Goldman’s executive leadership team since my first meeting with Sidney Weinberg in 1940.”

That sounds like high praise, but it’s actually a bit of folksy misdirection. Buffett has twice in his annual letters referred to Mae West‘s quote saying that “Too much of a good thing can be wonderful.” Assuming he expects Goldman shares to produce a good return, if a 2% stake is a good thing, surely 9% would be wonderful.

If Buffett prefers not to put up $5 billion to buy Goldman shares at $115 per share, he is implicitly signalling that believes he will find better uses for that capital. If one considers that the $115 cost basis he is passing up represents better than a 20% discount to today’s closing price, current investors may want to revisit their return assumptions.

To help figure out whether Goldman Sachs is a buy today, I invite you to read our premium research report on the …read more
Source: FULL ARTICLE at DailyFinance

The Terrifying Chart No One Is Looking At

By Austin Smith and Eric Bleeker, CFA, The Motley Fool

Filed under:

Despite a spike in the VIX , also called the Volatility Index or, unofficially, the “fear index,” on news of the Cyprus bank bailout, it’s still trading well below its average. While it may sound positive that market volatility and investor fear are thought to be very low at the moment, in this video Fool analysts Austin Smith and Eric Bleeker discuss how unusually low market volatility can often precede a major market correction. And with the Dow Jones Industrial Average continuing to hit one record high after another despite the news out of Cyprus, more and more analysts are fearing that a pullback could be just down the road. Austin tells investors how to thrive in a market like this, and how to find where to invest today.

One company Austin highlights that’s trading at an unbelievably cheap price today is Apple. There’s no doubt that Apple is at the center of technology’s largest revolution ever and that longtime shareholders have been handsomely rewarded, with more than 1,000% gains. However, there is a debate raging as to whether Apple remains a buy. The Motley Fool’s senior technology analyst and managing bureau chief, Eric Bleeker, is prepared to fill you in on both reasons to buy and reasons to sell Apple and what opportunities are left for the company (and your portfolio) going forward. To get instant access to his latest thinking on Apple, simply click here now.

var FoolAnalyticsData = FoolAnalyticsData || []; FoolAnalyticsData.push({ eventType: “TickerReportPitch”, contentByline: “Austin Smith and Eric Bleeker, CFA“, contentId: “cms.25405”, contentTickers: “DJINDICES:^DJI, NASDAQ:AAPL, NASDAQ:INTC, VOLATILITYINDICES:^VIX“, contentTitle: “The Terrifying Chart No One Is Looking At”, …read more
Source: FULL ARTICLE at DailyFinance

Did the Bull Market Just End in Cyprus?

By Alex Dumortier, CFA, The Motley Fool

Filed under:

The Cypriot agenda (there must be a Robert Ludlum novel by that name) continued to weigh on markets today, with the S&P 500
falling 0.2%. The narrower, price-weighted
Dow Jones Industrial Average
managed to squeak into the black with a gain of three-hundredths of a percentage point.

On the heels of a sizable 18% pop yesterday, the VIX , Wall Street‘s fear gauge, rose another 8% today, to close at 14.39. At that level, the index is still far below its long-term average, but at least we’re in a more credible range than we were last week. That it should even require a (small-scale) eurozone flare-up to rise to its present level says something about the degree to which investors have been lulled by the stock market rally into expecting quiet, steady price gains. (The VIX is calculated from S&P 500 option prices and reflects investor expectations for stock market volatility over the coming 30 days.)

Shades of 2011 and 2012
Here’s a look at the S&P 500 (blue line, left axis) and the VIX (red line, right axis) since the start of 2011: 

In each of the two previous years, the stock market‘s positive momentum was disrupted by macroeconomic events (including the U.S. debt ceiling debacle in 2011 and the eurozone crisis) and suffered significant pullbacks off its highs, before resuming its upward trajectory. Does this mean we’re now experiencing the start of the same pattern, triggered by Cyprus and international lenders’ shambolic handling of the situation?

Not necessarily. One thing to note is the declining magnitude of the associated “pops” in the VIX — we’ve not come close to the levels achieved in the second half of 2011. This suggests that professional investors’ risk aversion has declined markedly since then. In the U.S., that is largely — though not entirely — justified by improving corporate and macroeconomic fundamentals (despite a stagnant political class). Cyprus doesn’t look sufficient to alter that shift.

And if stocks do suffer a correction? If you are a net buyer of stocks, this is no cause for concern; in fact, stocks don’t look particularly cheap right now, so the value-focused investor might welcome the opportunity to put money to work at discounted prices.

If you’re finally ready to invest based on fundamentals, long-term value creation and competitive advantage, The Motley Fool’s chief investment officer has selected his No. 1 stock for this year. Find out which stock it is in the brand-new free report: “The Motley Fool’s Top Stock for 2013.” Just click here to access the report and find out the name of this under-the-radar company.

The article Did the Bull Market Just End in Cyprus? originally appeared on Fool.com.

Fool contributor <a target=_blank …read more
Source: FULL ARTICLE at DailyFinance

Is Bank of America a Value and a Momentum Stock?

By Alex Dumortier, CFA, The Motley Fool

Filed under:

Blame it

on Cyprus

! The S&P 500
was once more denied a new all-time high, as stocks fell on concerns that the eurozone crisis could be coming out of hibernation. The S&P 500 and the narrower, price-weighted Dow Jones Industrial Average
lost 0.6% and 0.4%, respectively.

Unsurprisingly, the VIX surged 18% today, to close at 13.36. That’s a massive move — nearly in the top 1% of daily percentage increases going back to the inception of the index in January 1990 — resulting from the exothermic reaction you get when you mix rekindled concerns about the eurozone crisis with “no pulse” levels of implied volatility. (The VIX is calculated from S&P 500 option prices and reflects investor expectations for stock market volatility over the coming 30 days.)


Appearing on CNBC today, financial-sector analyst Meredith Whitney was very bullish on Dow component Bank of America
, stating:

Bank of America was already one of the most undervalued names going into the stress tests. What’s amazing about this is very rarely do these banks have value and momentum, and this has both of those. The stress test was a huge catalyst for this name. It has been this huge stealth deliverer. They announced cost-cutting measures in 2010. No bank has taken the kind of [cost-cutting] measures it has taken. And it takes two years to implement those. It can easily go to $15. And over the next two years, into the $20s. It’s all cost-cutting, it’s all operating leverage. I don’t have a lot of growth expectations for the big banks in general.

Does Bank of America exhibit value and momentum and, if so, what might it mean for the shares going forward?

The second attribute, momentum, is easy to demonstrate. Whether it be over five days, one month, three months, six months or a year,  B of A is beating the S&P 500. Furthermore, although I’m no technician, I’m told that the shares’ 14-day relative strength of 82.9 indicates strong momentum. Finally, the share price is above its 50-, 100- and 200-day moving average. Momentum? Check.

As far as “value” goes, shares that trade at a near 40% discount to their book value must surely qualify (mind you, the discount to tangible book value — 4% — is much smaller). The forward price-to-earnings multiple of 12.5 is also below that of the broad market. Value? Check.

What does this mean for investors? The combination of “momentum” and “value” factors has historically produced above-normal returns (link opens a PDF), and while that’s a statistical statement, I think there’s reason to believe Bank of America will fit that pattern over the next …read more
Source: FULL ARTICLE at DailyFinance

Gold Won't Break $2,000 Before 2020

By Alex Dumortier, CFA, The Motley Fool

Filed under:

Yet another failed attempt. Stocks rose today, but the
S&P 500
failed once more to break its October 2007 all-time (nominal) high of 1,565.15. Incredibly, this marks the fourth day running that the index has closed within 1% of this level. Meanwhile, its narrower, price-weighted cousin, the
Dow Jones Industrial Average
, has now risen every day in March, for a nine-day winning streak. This is the longest streak since November 1996! In the process, it has managed to

set seven consecutive record highs

. For my take on the possible interpretation of these streaks, let me refer you to

my column from Monday

.

Consistent with rising stock prices, the VIX , Wall Street‘s fear gauge, declined 3.6% today, to close below 11.56. (The VIX is calculated from S&P 500 option prices and reflects investor expectations for stock market volatility over the coming 20 days.)

Gold loses its luster
Which is the worst-performing asset class this year? (Hint: It’s the only one that has ornamental value.) Still can’t find it? In that case, check out the following chart, courtesy of JPMorgan Chase:

It’s been roughly 18 months since gold set its (nominal) all-time high of $1,920 per ounce in September 2011. Since then, it’s been a difficult ride for gold, as macroeconomic fears have subsided (albeit in fits and starts) and the inflation bogeyman has yet to show its face. The result: Gold has lost nearly a fifth of its value in dollar terms — or, rather, the dollar has appreciated by a fifth in terms of gold, to satisfy strict gold-bug nomenclature.

I’m ready to make a long-range prediction regarding gold: Its price will not exceed $2,000 this side of the 2010s. This is not simply a case of kicking an asset when it’s down — I’ve been ruminating this thought for some time, but this is the first time I’m publishing the call. I justify it on three main axes:

  • The base case for inflation in the U.S. and other advanced economies is muted to mildly above-average inflation — not debilitating inflation, let alone hyperinflation.

  • The fiscal situation of the United States is currently less serious than gold bugs are willing to believe. It’s true the current path is unsustainable over the long term, but it is also true that this path can be redressed. The base case is that this will occur, with some painful, but tolerable, adjustments.

  • The …read more
    Source: FULL ARTICLE at DailyFinance

Top 4 Contrarian Reads

By Alex Dumortier, CFA, The Motley Fool

Filed under:

For all that is written on the topic, the key to beating the market can be boiled down to a single concept: variant perception. In order to earn a return that is different from the market average, you need to do different things, based on views that are different from the consensus. In that spirit, here are some of the best contrarian articles I read recently:

Buffett’s devil’s advocate
The annual Berkshire Hathaway shareholders’ meeting is somewhere between corporate event and religious pilgrimage, where members of the cult of value show their unwavering devotion to the Oracle of Omaha, Warren Buffett. However, this year Buffett is mixing it up. From Berkshire’s recently released annual letter (link opens PDF):

Finally — to spice things up — we would like to add to the panel a credentialed bear on Berkshire, preferably one who is short the stock. Not yet having a bear identified, we would like to hear from applicants. The only requirement is that you be an investment professional and negative on Berkshire.

Media-friendly hedge fund manager Doug Kass has already stepped up to the plate and will be this year’s “credentialed bear.” To get an idea of the challenges Kass might raise, head over to Michael Santoli’s “Warren Buffett and the 3 Bearish Questions.” Here’s one of Santoli’s questions:

How can that premium valuation be justified, now and in the future, given three facts: As you have frequently conceded, you will not be here to run things forever; at Berkshire’s present enormous size, it would appear very unlikely the past value creation pace can be approximated; and there are huge latent tax liabilities on the balance sheet from your tremendously appreciated equity positions?

The Dow: What’s all the fuss about?
To great fanfare, the Dow Jones Industrial Average set a new all-time (nominal) high last week, surpassing the mark it had established in Oct. 2007. Unfortunately, the level of coverage this milestone received is out of all proportion with the Dow’s financial and economic significance. The Financial Times‘ John Authers rightly argues that the Dow should be consigned to history [registration may be required]:

By robust measures such as the S&P 500 , US equity markets are almost back to their highs of 2007, and could get there any day. This is a remarkably swift recovery from the 2007-09 implosion and a remarkable disconnect, both with the rest of the world and with most perceptions of the health of the US economy. How did this happen?

The Dow does not help answer this question. But as market perceptions can be self-fulfilling, attention to the Dow may have egged on the animal spirits that are pushing US stocks higher and fuelled that underlying disconnect. It really would be best if everyone could get used to ignoring the Dow.

If it ain’t broke, don’t VIX it
I’m fascinated by …read more
Source: FULL ARTICLE at DailyFinance

4 Crazy Market Statistics: DJIA, VIX, Crude &amp; Treasuries

By 24/7 Wall St.

NYSE-flag

Filed under: , ,

The DJIA winning streak continues, S&P 500 does not… The S&P 500 Index might have closed down slightly with a 3.74 drop breaking its 7 day winning streak, but the Dow Jones Industrial Average barely closed up on the day but at yet another record high closing price and that makes eight days in a row for the DJIA. The last negative day on the DJIA was February 28 at a close of 14,054.49 versus a closing bell price of 14,450.06 on Tuesday, March 12 for a streak of 2.8%. The NIKKEI 225 in Japan broke an 8-day winning streak.

The CBOE Volatility Index finally went back up as the S&P was negative and the index rose 6.3% to 12.29. That is historically very low and perhaps should be called “The Complacency Index” rather than “The Fear Index.” We would note that the new 52-week range for the VIX is 11.50 to 27.73. Since the latest consecutive stock rally, the VIX fell from 15.50 down to under 12 before Tuesday’s gain.

West Texas Crude is up 2.6% since bottoming out 7 trading sessions ago around $90.50 per barrel at the close of $92.80 today. What happens if the recovery manages to continue recovering?

Bonds may have pulled back down in yield from the near-term highs, but in the last 90 days interest rates have continued to rise. The 10-Year Treasury Note is up over 30 basis points at about 2.02%. The 30-Year Treasury Bond is also still up more than 30 basis from 90 days ago, at 3.22% versus 2.89%. You are seeing rates tick up in mortgages as well with Zillow saying, “The Thirty year fixed mortgage rate on March 12, 2013, is up 12 basis points from the previous week’s average rate of 3.46% and up 38 basis points from the average rate of 3.20% from three months ago.”

Filed under: 24/7 Wall St. Wire, Active Trader, Economy, Index, Personal Finance

Read | Permalink | Email this | Linking Blogs | Comments

…read more
Source: FULL ARTICLE at DailyFinance

Is This Evidence the Market Is Rigged?

By Alex Dumortier, CFA, The Motley Fool

Filed under:

With four back-to-back

all-time nominal highs

in the
Dow Jones Industrial Average
last week, the Dow’s broader, better-constructed counterpart, the
S&P 500
must be starting to feel a bit sheepish. Indeed, it remained unable to break its Oct. 2007 high today, despite gaining 0.3% on the day. That milestone can’t be far ahead, however, with the mark now less than six-tenths of a percentage point away. Given the recent consistency of daily stock market gains, we might expect to hit it within the next two to three days.

Speaking of which, have you noticed that stocks have risen every day so far this month? That’s a seven-day winning streak, and should the S&P 500 manage to finish in the black tomorrow, that would produce us our second eight-day winning streak since… January. Prior to that, one has to go back to more than eight years, to Nov. 2006, in order to find one. That looks like an anomaly to me, but one must be careful in examining a long number series with a heavy randomness. However, there are other observations that look a bit odd, too.

To wit, where stock indexes have been on an relentless upward march, the VIX Index , Wall Street‘s fear gauge, has been driven down systematically. Today, the index lost another 8%, closing at 11.56 — the last time it closed there was on Dec. 29, 2006. We are beginning to plumb the depths of the index’s historical range; for reference, 11.52 is the threshold value for the bottom 5% of values going back to the VIX‘s inception in Jan. 1990 (the VIX is calculated from S&P 500 option prices and reflects investor expectations for stock market volatility over the coming 30 days).

“Rigged” is a loaded term, which I chose purposefully, mainly for its shock value. Nevertheless, faithful readers of this column will recognize a theme of mine: This market is not, for lack of a better word, “normal.” Furthermore, the “Bernanke put,” by its nature, is a source of anomalies and distortions. I think it’s possible that the phenomena I have described above are manifestations of this. The conclusion is clear and I must repeat it like a mantra: Avoid leverage, stay focused on long-term, fundamental value, and don’t get lulled into thinking the “up” days will never end.

The Motley Fool’s chief investment officer has selected his No. 1 stock for this year. Find out which stock it is in the brand-new free report: “The Motley Fool’s Top Stock for 2013.” Just click here to access …read more
Source: FULL ARTICLE at DailyFinance

Dow Ends at a Record Again, S&amp;P in 7th Straight Gain

By Reuters

Dow ends at a record again, S&P in 7th straight gain

Filed under: ,

By Chuck Mikolajczak

NEW YORK – Wall Street rose modestly on Monday, lifting the Dow to another record and giving the S&P 500 its seventh straight advance as early weakness enticed buyers. The gains briefly lifted the benchmark S&P 500 index to its highest intraday level since October 2007.

With the slight advance, U.S. stocks continued last week’s rally that took the Dow Jones industrial average to record highs. The S&P 500’s record closing high stands at 1,565.15, which it reached on Oct. 9, 2007.

Wall Street‘s “fear gauge” closed at its lowest level since February 2007, suggesting investors were not spooked by Monday’s brief pullback, despite expectations by many investors that a correction may be looming. The CBOE Volatility Index, known as the VIX, dropped 8.2 percent to 11.56.

U.S. equities have rallied strongly since the start of the year, helped by signs of improvement in the economy and the support of equities by the Federal Reserve‘s quantitative easing program. These factors have contained recent pullbacks as investors have used them as a buying opportunity.

“These dips are consistently bought. There is definitely a soft floor for the market,” said Peter Kenny, managing director at Knight Capital in Jersey City, New Jersey.

“It’s a QE bid,” Kenny said, referring to the Fed’s policy of keeping short-term interest rates near zero since late 2008. “Quite frankly, earnings have not disappointed to the point where it is has been disrupted, and there is nothing out there that seems to be getting in the way of this slow but very consistent and methodical drift higher in the market.”

But volume was light, with about 5.39 billion shares traded on the New York Stock Exchange, NYSE MKT and Nasdaq, below the daily average of 6.47 billion, suggesting the rally may be losing steam.

On Monday, the S&P 500 climbed as high as 1,556.27 – its highest intraday level since Oct. 15, 2007.

The Dow has gained over 10 percent for the year, while the S&P 500 is up more than 9 percent.

Wall Street had traded slightly lower earlier in the day as Italy‘s credit downgrade and disappointing Chinese economic data gave investors a reason to pause.

The Dow Jones industrial average gained 50.22 points, or 0.35 percent, to 14,447.29, a record closing high. The Standard & Poor’s 500 Index rose 5.04 points, or 0.32 percent, to 1,556.22. The Nasdaq Composite Index added 8.51 points, or 0.26 percent, to close at 3,252.87.

Earlier in the session, the Dow reached another lifetime intraday high, rising as high as 14,448.06.

Sponsored Linksadsonar_placementId=1505951;adsonar_pid=1990767;adsonar_ps=-1;adsonar_zw=242;adsonar_zh=252;adsonar_jv=’ads.tw.adsonar.com’;

Boeing Co (BA) rose to $83.03, its highest level since May 2008, after the U.S. aircraft manufacturer said strong demand was prompting it to increase its production rates of commercial planes. The stock, which rose 2 percent to $82.94 at the close, was the Dow’s biggest percentage gainer. Boeing also gave …read more
Source: FULL ARTICLE at DailyFinance

VIX Hits Almost 6 Year Lows, Complacency Replaces Fear

By 24/7 Wall St.

Stock Split Image

Filed under: , , , ,

The Volatility Index, a.k.a. the VIX, just hit a 52-week low. Make that a multi-year low, all the way back to April of 2007. Is the “fear index” showing a market that is overly bought and ripe for a correction? It may just be signaling that we are in the midst of one major rally that can keep running and running. The move we are seeing is being confirmed by the iPath S&P 500 VIX ST Futures ETN (NYSEMKT: VXX). This exchange-traded note is also at a 52-week low.

Some market observers may start to say that this alone may be marking some seriously overbought territory for the broad stock market. 2013 has been a great year for stocks with record inflows for the first two months of the year. The problem is that as the VIX gets lower and lower it signals extreme complacency. The good news for the bulls (and bad news for the bears) is that the VIX can theoretically remain extremely low indefinitely (or until all the stock buying money runs out).

The prior 52-week range in the VIX was $12.08 to $27.73. The low on Monday was $11.68 and the reading is now just over 11.75. If you have some serious gains you want to protect, it needs to be said that buying put options to hedge against downside is generally as cheap as it can get right now.

After reviewing the historical charts, the low on the VIX has now been under 13 for three consecutive calendar months. That takes us back to the end of 2007 before you can find a reading of that sort. The last time the reading was this low for an extended period was what led to the bull market before the great recession. We would note that a low VIX can go even lower as there were times that the index dropped to under 10 briefly in 2005, 2006, and again in 2007. It was in April of 2005 that the DJIA was as low as 10,000 and it was up at 14,000 by July of 2007.

The VIX is a great tool for finding seriously oversold markets that at a minimum need a serious technical trading bounce. Evaluating it down at the lows sometimes has been followed only by lower lows. The good news for any chicken-bulls is simple: put options to hedge new positions or to lock in gains are currently dirt cheap.

Filed under: 24/7 Wall St. Wire, Active Trader, Banking & Finance, Economy, ETFs & Mutual Funds, Index, Personal Finance Tagged: VXX

Read | Permalink | Email this | Linking Blogs | Comments

…read more
Source: FULL ARTICLE at DailyFinance

Has the Commodities Bubble Burst at Investment Banks?

By Alex Dumortier, CFA, The Motley Fool

Source: CBOE

Two observations here:

  • Volatility was lower in 2012 than in any 12-month period since the onset of the credit crisis in the second half of 2007.

  • The volatility of oil tracks that of stocks closely, reflecting the risk-on/risk-off dynamic that has dominated financial markets during the crisis and post-crisis eras.

Investment banks are notorious for their “boom-bust” approach to business, riding cyclical profit opportunities to the hilt until the opportunity dwindles and they are forced to retrench. If commodities markets continue to normalize and volatility remains muted, we could see another wave of savage job cuts at the investment banks.

With big finance firms still trading at deep discounts to their historic norms, investors everywhere are wondering if this is the new normal or if finance stocks are a screaming buy today. The answer depends on the company, so to help you figure out

Filed under:

After a


record-breaking run last week

, stocks opened slightly lower this morning, with the
S&P 500
and the narrower, price-weighted
Dow Jones Industrials Average
down 0.16% and 0.11%, respectively, as of 10:05 a.m. EDT.

The week ahead
This is a low-impact week in terms of scheduled data releases. Tomorrow, we’ll get earnings from retailing powerhouse Costco; on Wednesday, we’ll be able to weigh those results against national retail-sales numbers. Friday will see the release of consumer price inflation data for the month of February, along with a host of manufacturing-related indexes

Bursting the bubble
This morning, Reuters has an interesting piece on the decline of commodities profits at investment banks — particularly Goldman Sachs , where revenue from its commodities franchise has fallen 90% from its 2009 level of $4.5 billion, including a 60% drop last year. Dow component JPMorgan Chase is now thought to be the leading investment bank in commodities markets.

The reasons for this industrywide trend are twofold: restrictions on proprietary trading — trading for the bank’s own account — that are being introduced as part of the Dodd-Frank legislation and the drop in commodities market volatility. On the second point, the following monthly chart shows the CBOE Crude Oil Volatility Index (blue line) versus the VIX index (red line). Both indexes are calculated from option prices and reflect the market‘s expectations for short-term volatility — the former for crude oil and the latter for the S&P 500.

Source: CBOE

Two observations here:

  • Volatility was lower in 2012 than in any 12-month period since the onset of the credit crisis in the second half of 2007.

  • The volatility of oil tracks that of stocks closely, reflecting the risk-on/risk-off dynamic that has dominated financial markets during the crisis and post-crisis eras.

Investment banks are notorious for their “boom-bust” approach to business, riding cyclical profit opportunities to the hilt until the opportunity dwindles and they are forced to retrench. If commodities markets continue to normalize and volatility remains muted, we could see another wave of savage job cuts at the investment banks.

With big finance firms still trading at deep discounts to their historic norms, investors everywhere are wondering if this is the new normal or if finance stocks are a screaming buy today. The answer depends on the company, so to help you figure out whether JPMorgan is a buy today, I invite you to read our premium research report on the company today. Click here now for instant access!

…read more
Source: FULL ARTICLE at DailyFinance

The Dow's New All-Time High by the Numbers

By Alex Dumortier, CFA, The Motley Fool

^DJI Chart

Filed under:

We’re there! This morning, investors pushed the
Dow Jones Industrials Average
above its all-time closing high as well as its intraday record. As of 12 p.m. EST, the index is up 150 points, or 1%, to 14,278. Meanwhile, the broader
S&P 500
is up 1% to 1,542. Fittingly, the VIX index, Wall Street‘s fear gauge, is down 5%.

Breaking it down
The biggest percentage gainers in the Dow this morning belonged to “old tech” (
Cisco Systems and Hewlett-Packard), financials (American Express, Bank of America, and JPMorgan) and conglomerates (United Technologies and General Electric). However, the Dow is price-weighted, so the single biggest contributor to the index’s advance today is IBM, which is up about 1%.

The last time we were at these levels was during the heroic last gasp of a mortally wounded bull market. The U.S. financial system was teetering on the edge of a precipice that would ultimately engulf the global economy. It’s clear, with the benefit hindsight, that underlying fundamentals are sounder today than they were then, but it’s worth characterizing that observation.

The following graph, for example, displays the performance of the Dow Jones Industrial Average (blue line) between Oct. 9, 2007  and yesterday; U.S. gross domestic product (orange line), a measure of economic activity; and the Shiller P/E of the S&P 500 (red line), a long-term indicator of stock valuations:

^DJI data by YCharts.

In sum, while stock prices are flat (ex-dividends) over this period, economic activity has increased, albeit slowly, and stock valuations have come down nearly 20%. That’s a much healthier context for further stock-price gains, but risk is still present. The aforementioned Shiller P/E, which is calculated based on average trailing-10-year real earnings per share remains substantially above its long-term historical average. Investors need to stay alert.

The article The Dow’s New All-Time High by the Numbers originally appeared on Fool.com.

Fool contributor Alex Dumortier, CFA has no position in any stocks mentioned; you can follow him on LinkedIn. The Motley Fool has no position in any of the stocks mentioned. Try any of our Foolish newsletter services free for 30 days. We Fools may not all hold the same opinions, but we all believe that considering a diverse range of insights makes us better investors. The Motley Fool has a disclosure policy.

Copyright © 1995 – 2013 The Motley Fool, LLC. All rights reserved. The Motley Fool has a disclosure policy.

(function(c,a){window.mixpanel=a;var b,d,h,e;b=c.createElement(“script”);
b.type=”text/javascript”;b.async=!0;b.src=(“https:”===c.location.protocol?”https:”:”http:”)+
‘//cdn.mxpnl.com/libs/mixpanel-2.2.min.js’;d=c.getElementsByTagName(“script”)[0];
d.parentNode.insertBefore(b,d);a._i=[];a.init=function(b,c,f){function d(a,b){
var c=b.split(“.”);2==c.length&&(a=a[c[0]],b=c[1]);a[b]=function(){a.push([b].concat(
…read more
Source: FULL ARTICLE at DailyFinance

TD Ameritrade's Investor Movement Index: February Numbers Spike as a Result of Increased Equity Expo

By Business Wirevia The Motley Fool

Filed under:

TD Ameritrade’s Investor Movement Index: February Numbers Spike as a Result of Increased Equity Exposure and Low Market Volatility

IMX posts highest month-over-month increase as investor bullishness continues

OMAHA, Neb.–(BUSINESS WIRE)– TD Ameritrade, Inc. (“TD Ameritrade”), a broker-dealer subsidiary of TD Ameritrade Holding Corporation (NYS: AMTD) , is today revealing the Investor Movement IndexSM score for February 2013. The Investor Movement Index, or the IMXSM, is a proprietary, behavior-based index created by TD Ameritrade that aggregates Main Street investor positions and activity to measure what investors are actually doing and how they are actually positioned in the markets.

The February 2013 Investor Movement Index for the four weeks ending Feb. 22, 2013, reveals:

  • Score: 5.14 (compared to 4.71 in January)
  • Trend Direction: Positive
  • Trend Length: 1 Month
  • Score relative to historic ranges: High

February’s IMX score is the highest seen since June 2011 and part of an increasingly bullish trend spanning much of the last seven months. In February, retail investors at TD Ameritrade continued to show signs of bullishness. Net buyers in the markets, investors were rotating their equity exposure, selling securities at highs and buying into lows. Portfolio positioning also played a role in the higher monthly score. Volatility across the broad market, as measured by indicators like the VIX, was quite low in February. TD Ameritrade clients held or increased their exposure to securities with higher relative volatility compared to that of the general market. This was a key factor in the higher IMX score seen in February.

“This score is a contrast to January’s IMX number, which dipped slightly from December after several months of gains,” said Steve Quirk, senior vice president of TD Ameritrade’s Trader Group. “Given the circumstances around that time frame, such as uncertainty regarding the fiscal cliff and annual portfolio adjustments typically made at that time of year, it likely reflected unique conditions at year end. Now that those events are behind us, we are seeing results more aligned with national consumer sentiment indices.”

The IMX value is calculated based on a complex proprietary formula. Each month, TD Ameritrade pulls a sample from its client base of 6 million …read more
Source: FULL ARTICLE at DailyFinance

Low-Volatility ETFs Beat Low-Volatility Market

By Paul Baiocchi, Contributor

The VIX finally awoke from its slumber last week as the market sold off by the largest amount in months. The “spike” in the most widely followed gauge of volatility, the VIX, comes at a convenient time for one issuer who just so happened to expand its offering of low-volatility ETFs just this month. …read more
Source: FULL ARTICLE at Forbes Latest