Tag Archives: Peter Lynch

Fuel Systems Solutions Beats on Both Top and Bottom Lines

By Seth Jayson, The Motley Fool

Filed under:

Fuel Systems Solutions (NAS: FSYS) reported earnings on March 8. Here are the numbers you need to know.

The 10-second takeaway
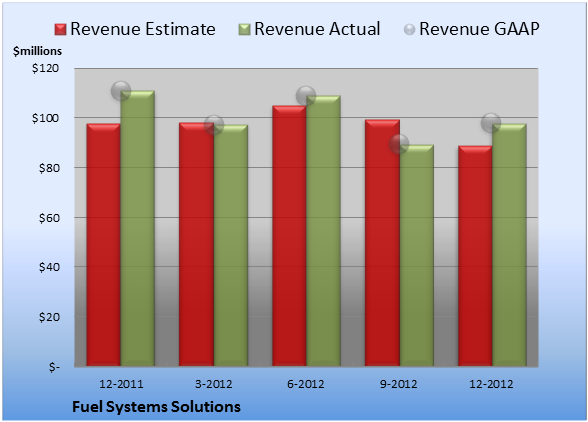
For the quarter ended Dec. 31 (Q4), Fuel Systems Solutions beat expectations on revenues and beat expectations on earnings per share.

Compared to the prior-year quarter, revenue shrank. Non-GAAP earnings per share dropped significantly. GAAP earnings per share shrank to a loss.

Gross margins were steady, operating margins dropped, net margins dropped.

Revenue details
Fuel Systems Solutions chalked up revenue of $98.0 million. The eight analysts polled by S&P Capital IQ looked for net sales of $88.8 million on the same basis. GAAP reported sales were 12% lower than the prior-year quarter’s $111.0 million.

Source: S&P Capital IQ. Quarterly periods. Dollar amounts in millions. Non-GAAP figures may vary to maintain comparability with estimates.

EPS details
EPS came in at $0.01. The eight earnings estimates compiled by S&P Capital IQ averaged -$0.03 per share. Non-GAAP EPS of $0.01 for Q4 were 86% lower than the prior-year quarter’s $0.07 per share. GAAP EPS were -$1.05 for Q4 against $0.07 per share for the prior-year quarter.

Source: S&P Capital IQ. Quarterly periods. Non-GAAP figures may vary to maintain comparability with estimates.

Margin details
For the quarter, gross margin was 21.8%, much about the same as the prior-year quarter. Operating margin was 1.3%, 40 basis points worse than the prior-year quarter. Net margin was -21.4%, much worse than the prior-year quarter. (Margins calculated in GAAP terms.)

Looking ahead
Next quarter’s average estimate for revenue is $93.9 million. On the bottom line, the average EPS estimate is $0.10.

Next year’s average estimate for revenue is $414.1 million. The average EPS estimate is $0.58.

Investor sentiment
The stock has a four-star rating (out of five) at Motley Fool CAPS, with 471 members out of 531 rating the stock outperform, and 60 members rating it underperform. Among 104 CAPS All-Star picks (recommendations by the highest-ranked CAPS members), 81 give Fuel Systems Solutions a green thumbs-up, and 23 give it a red thumbs-down.

Of Wall Street recommendations tracked by S&P Capital IQ, the average opinion on Fuel Systems Solutions is hold, with an average price target of $19.83.

The rich are different than you and me: They might not notice the moneymaking stories right under our noses. In our new report, “Middle-Class Millionaire-Makers: 3 Stocks Wall Street’s Too Rich to Notice,” we give you three Peter Lynch-inspired buy-what-you-know stocks for the 99%. Click here for instant access to this free report.

The …read more
Source: FULL ARTICLE at DailyFinance

SunOpta Increases Sales but Misses Estimates on Earnings

By Seth Jayson, The Motley Fool

Filed under:

SunOpta (NAS: STKL) reported earnings on March 5. Here are the numbers you need to know.

The 10-second takeaway
For the quarter ended Dec. 29 (Q4), SunOpta beat expectations on revenues and missed estimates on earnings per share.

Compared to the prior-year quarter, revenue increased. Non-GAAP earnings per share expanded. GAAP earnings per share increased.

Gross margins shrank, operating margins expanded, net margins increased.

Revenue details
SunOpta logged revenue of $270.1 million. The six analysts polled by S&P Capital IQ looked for net sales of $263.5 million on the same basis. GAAP reported sales were the same as the prior-year quarter’s.

Source: S&P Capital IQ. Quarterly periods. Dollar amounts in millions. Non-GAAP figures may vary to maintain comparability with estimates.

EPS details
EPS came in at $0.08. The nine earnings estimates compiled by S&P Capital IQ predicted $0.09 per share. Non-GAAP EPS of $0.08 for Q4 were 14% higher than the prior-year quarter’s $0.07 per share. (The prior-year quarter included -$0.05 per share in earnings from discontinued operations.) GAAP EPS were $0.06 for Q4 versus -$0.12 per share for the prior-year quarter.

Source: S&P Capital IQ. Quarterly periods. Non-GAAP figures may vary to maintain comparability with estimates.

Margin details
For the quarter, gross margin was 10.7%, 70 basis points worse than the prior-year quarter. Operating margin was 2.5%, 50 basis points better than the prior-year quarter. Net margin was 1.6%, 450 basis points better than the prior-year quarter.

Looking ahead
Next quarter’s average estimate for revenue is $283.4 million. On the bottom line, the average EPS estimate is $0.11.

Next year’s average estimate for revenue is $1.17 billion. The average EPS estimate is $0.47.

Investor sentiment
The stock has a one-star rating (out of five) at Motley Fool CAPS, with 226 members out of 328 rating the stock outperform, and 102 members rating it underperform. Among 82 CAPS All-Star picks (recommendations by the highest-ranked CAPS members), 32 give SunOpta a green thumbs-up, and 50 give it a red thumbs-down.

Of Wall Street recommendations tracked by S&P Capital IQ, the average opinion on SunOpta is outperform, with an average price target of $8.31.

The rich are different than you and me: They might not notice the moneymaking stories right under our noses. In our new report, “Middle-Class Millionaire-Makers: 3 Stocks Wall Street’s Too Rich to Notice,” we give you three Peter Lynch-inspired buy-what-you-know stocks for the 99%. Click here for instant access to this free report.

The article SunOpta Increases Sales but Misses Estimates on Earnings originally …read more
Source: FULL ARTICLE at DailyFinance

Are You Expecting This from John Bean Technologies?

By Seth Jayson, The Motley Fool

Filed under:

John Bean Technologies (NYS: JBT) is expected to report Q4 earnings on March 6. Here’s what Wall Street wants to see:

The 10-second takeaway
Comparing the upcoming quarter to the prior-year quarter, average analyst estimates predict John Bean Technologies‘s revenues will grow 10.4% and EPS will expand 29.2%.

The average estimate for revenue is $299.8 million. On the bottom line, the average EPS estimate is $0.62.

Revenue details
Last quarter, John Bean Technologies reported revenue of $205.3 million. GAAP reported sales were 11% lower than the prior-year quarter’s $230.3 million.

Source: S&P Capital IQ. Quarterly periods. Dollar amounts in millions. Non-GAAP figures may vary to maintain comparability with estimates.

EPS details
Last quarter, EPS came in at $0.21. GAAP EPS of $0.21 for Q3 were 25% lower than the prior-year quarter’s $0.28 per share.

Source: S&P Capital IQ. Quarterly periods. Non-GAAP figures may vary to maintain comparability with estimates.

Recent performance
For the preceding quarter, gross margin was 25.3%, 50 basis points better than the prior-year quarter. Operating margin was 5.0%, 110 basis points worse than the prior-year quarter. Net margin was 3.0%, 50 basis points worse than the prior-year quarter.

Looking ahead

The full year’s average estimate for revenue is $923.2 million. The average EPS estimate is $1.23.

Investor sentiment
The stock has a four-star rating (out of five) at Motley Fool CAPS, with 101 members out of 104 rating the stock outperform, and three members rating it underperform. Among 42 CAPS All-Star picks (recommendations by the highest-ranked CAPS members), 42 give John Bean Technologies a green thumbs-up, and give it a red thumbs-down.

Of Wall Street recommendations tracked by S&P Capital IQ, the average opinion on John Bean Technologies is outperform, with an average price target of $19.33.

The rich are different than you and me: They might not notice the moneymaking stories right under our noses. In our new report, “Middle-Class Millionaire-Makers: 3 Stocks Wall Street‘s Too Rich to Notice,” we give you three Peter Lynch-inspired buy-what-you-know stocks for the 99%. Click here for instant access to this free report.

The article Are You Expecting This from John Bean Technologies? originally appeared on Fool.com.


Seth Jayson had no position in any company mentioned here at the time of publication. You can view his stock holdings here. He is co-advisor of
Motley Fool Hidden Gems, which provides new small-cap ideas every month, backed by a real-money portfolio. The Motley Fool owns shares of John Bean …read more
Source: FULL ARTICLE at DailyFinance