Tag Archives: Tower International

1 Reason Tower International Looks Attractive

By Seth Jayson, The Motley Fool

Filed under:

Margins matter. The more Tower International (NYS: TOWR) keeps of each buck it earns in revenue, the more money it has to invest in growth, fund new strategic plans, or (gasp!) distribute to shareholders. Healthy margins often separate pretenders from the best stocks in the market. That’s why we check up on margins at least once a quarter in this series. I’m looking for the absolute numbers, so I can compare them to current and potential competitors, and any trend that may tell me how strong Tower International‘s competitive position could be.

Here’s the current margin snapshot for Tower International over the trailing 12 months: Gross margin is 10.1%, while operating margin is 3.8% and net margin is 0.9%.

Unfortunately, a look at the most recent numbers doesn’t tell us much about where Tower International has been, or where it’s going. A company with rising gross and operating margins often fuels its growth by increasing demand for its products. If it sells more units while keeping costs in check, its profitability increases. Conversely, a company with gross margins that inch downward over time is often losing out to competition, and possibly engaging in a race to the bottom on prices. If it can’t make up for this problem by cutting costs — and most companies can’t — then both the business and its shares face a decidedly bleak outlook.

Of course, over the short term, the kind of economic shocks we recently experienced can drastically affect a company’s profitability. That’s why I like to look at five fiscal years’ worth of margins, along with the results for the trailing 12 months, the last fiscal year, and last fiscal quarter (LFQ). You can’t always reach a hard conclusion about your company’s health, but you can better understand what to expect, and what to watch.

Here’s the margin picture for Tower International over the past few years.

Source: S&P Capital IQ. Dollar amounts in millions. FY = fiscal year. TTM = trailing 12 months.

Because of seasonality in some businesses, the numbers for the last period on the right — the TTM figures — aren’t always comparable to the FY results preceding them. Here’s how the stats break down:

  • Over the past five years, gross margin peaked at 10.9% and averaged 9.0%. Operating margin peaked at 3.8% and averaged 2.2%. Net margin peaked at 0.9% and averaged -1.8%.
  • TTM gross margin is 10.1%, 110 basis points better than the five-year average. TTM operating margin is 3.8%, 160 basis points better than the five-year average. TTM net margin is 0.9%, 270 basis points better than the five-year average.

With TTM operating and net margins at a 5-year high, …read more

Source: FULL ARTICLE at DailyFinance

Don't Get Too Worked Up Over Tower International's Earnings

By Seth Jayson, The Motley Fool

Filed under:

Although business headlines still tout earnings numbers, many investors have moved past net earnings as a measure of a company’s economic output. That’s because earnings are very often less trustworthy than cash flow, since earnings are more open to manipulation based on dubious judgment calls.

Earnings’ unreliability is one of the reasons Foolish investors often flip straight past the income statement to check the cash flow statement. In general, by taking a close look at the cash moving in and out of the business, you can better understand whether the last batch of earnings brought money into the company, or merely disguised a cash gusher with a pretty headline.

Calling all cash flows

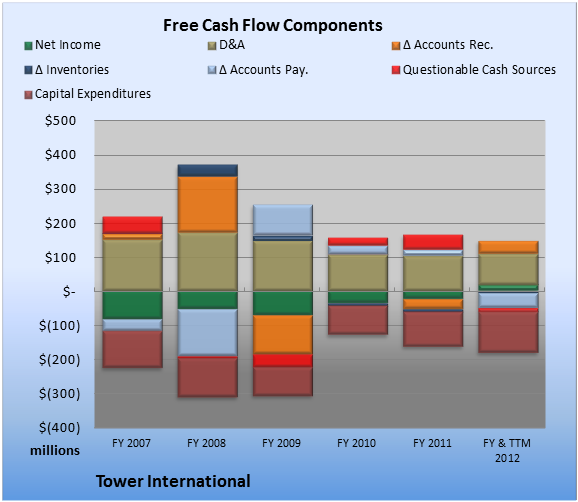
When you are trying to buy the market’s best stocks, it’s worth checking up on your companies’ free cash flow once a quarter or so, to see whether it bears any relationship to the net income in the headlines. That’s what we do with this series. Today, we’re checking in on Tower International (NYS: TOWR) , whose recent revenue and earnings are plotted below.

Source: S&P Capital IQ. Data is current as of last fully reported fiscal quarter. Dollar values in millions. FCF = free cash flow. FY = fiscal year. TTM = trailing 12 months.

Over the past 12 months, Tower International burned $29.0 million cash while it booked net income of $18.0 million. That means it burned through all its revenue and more. That doesn’t sound so great. FCF is less than net income. Ideally, we’d like to see the opposite.

All cash is not equal
Unfortunately, the cash flow statement isn’t immune from nonsense, either. That’s why it pays to take a close look at the components of cash flow from operations, to make sure that the cash flows are of high quality. What does that mean? To me, it means they need to be real and replicable in the upcoming quarters, rather than being offset by continual cash outflows that don’t appear on the income statement (such as major capital expenditures).

For instance, cash flow based on cash net income and adjustments for non-cash income-statement expenses (like depreciation) is generally favorable. An increase in cash flow based on stiffing your suppliers (by increasing accounts payable for the short term) or shortchanging Uncle Sam on taxes will come back to bite investors later. The same goes for decreasing accounts receivable; this is good to see, but it’s ordinary in recessionary times, and you can only increase collections so much. Finally, adding stock-based compensation expense back to cash flows is questionable when a company hands out a lot of equity to employees and uses cash in later periods to buy back those …read more
Source: FULL ARTICLE at DailyFinance